Modern civilization runs on oil, not just as a fuel, but as the raw material for plastics, metals, roads, and the food on your plate. Using commodity price data from the World Bank “Pink Sheet”, this article maps how oil prices ripple through the industrial backbone of the modern world, from metals like iron and copper to rubber, timber, and vegetable oils. In a previous piece, I explored how the blockade of the Strait of Hormuz increased oil prices, which in turn affected fertilizer prices, which trickle down to food; here, the analysis extends to the broader commodity landscape.
Before moving on, we need to revisit some energy fundamentals and why escaping oil is far harder than it sounds on paper.
Why escaping oil is harder than it sounds
To understand the global economy, you first have to understand the difference between Molecules (Hydrocarbons) and Electrons (Power).
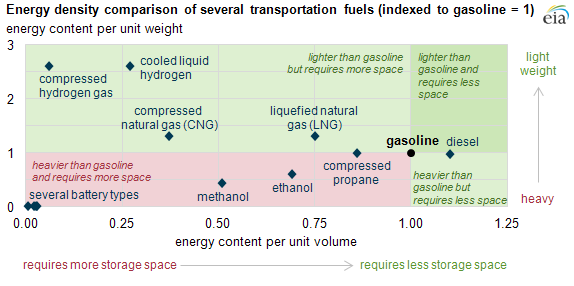
Take a look at the graphic above. Not all energy sources are created equal: oil-derived fuels like gasoline and diesel are energy-dense and require less space. While Lithium Nickel Manganese Cobalt (NMC) batteries have pushed the boundaries of energy density for consumer electronics to 200 Wh/kg, they remain an order of magnitude behind the energy density of 12,000 Wh/kg (45 MJ/kg) found in a typical gallon of diesel used in industrial applications.
These figures don’t save face for the battery; they illustrate the sheer physical height of the mountain we have to climb to escape the molecular gap. This “density gap” is why heavy industry is physically tethered to the molecule.
Electrons in batteries simply cannot yet provide the concentrated “punch” needed for high-heat manufacturing to power smelters or long-haul transport of goods, but suffice for consumer-electronics use, like the laptop or phone you are probably reading this on.
What a barrel of oil actually makes
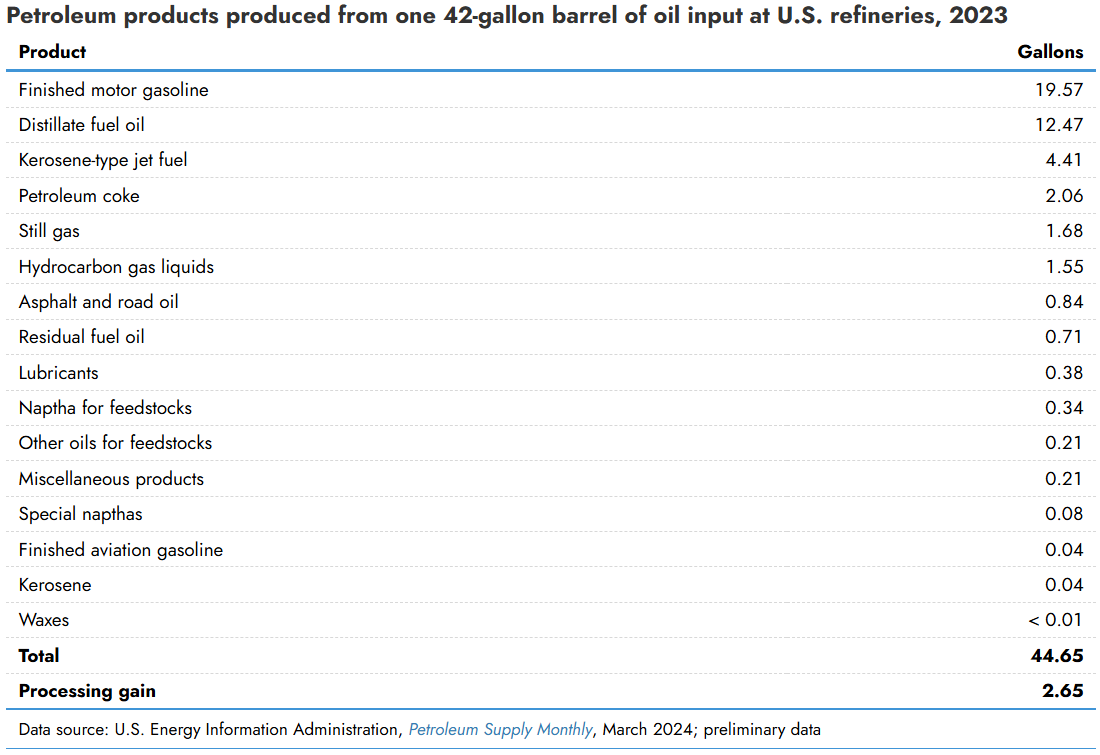
Take a look at the table above. We often think of oil and gas as things we burn, like petrol in our cars, diesel in trucks, and jet fuel to power aircraft, but oil is also something we build with. For example, distilling a 42-gallon barrel of crude oil at different temperatures using fractional distillation yields multiple products we use in everyday life that we often overlook.
Some examples of such oil products include naphtha, used for petrochemical feedstock that is cracked into ethylene and propylene, the building blocks of plastics and synthetic fibers you own; asphalt, used for paving roads on which we walk and drive our cars everyday; Petroleum coke, a solid carbon residue which fires the industrial smelters that produce the aluminium, copper, and steel inside your electronics and batteries. And residual fuel oil (HFO) powers the cargo ships that move virtually everything we consume.
Hence, you cannot have a tech sector, an automotive sector, or an energy transition without oil. The same applies to plastics used in the casing of your smartphone, the chassis of budget laptops, the packaging around your food, and synthetic fabrics like polyester and nylon, which make up a large share of the clothes you wear, especially for waterproof jackets and football jerseys. Ironic, given that to escape oil, we must first consume more of it.
What the data shows: oil prices move through everything
Now that we have established the basic energy fundamentals and the products derived from a barrel of crude oil, we can use a simple correlation test based on data from the World Bank’s Pink Sheet comparing oil prices with those of other commodities. My aim here is not to drown readers in statistics but to show how oil prices travel through other commodities, as I did with exploring how oil prices affect fertilizers and food.
How oil drives the prices of industrial metals
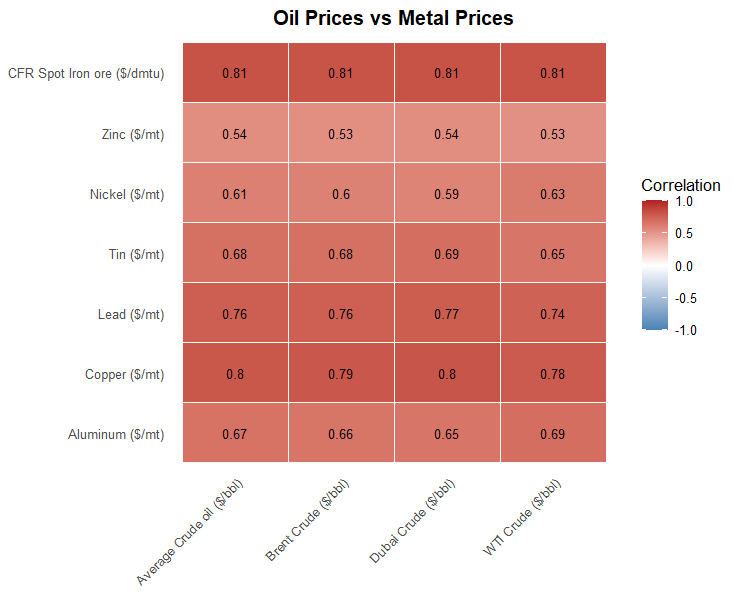
The commodity correlation matrix extends beyond food and fertilizers to the industrial backbone of modern civilization. Data from the World Bank “Pink Sheet” confirm that crude oil prices, be it Brent, Dubai, or West Texas (WTI), track metal prices with remarkable uniformity, showing that oil prices are linked to metal price dynamics.
Iron ore stands out as the most tightly correlated across the board, registering a correlation of 0.81 against all four oil benchmarks, underscoring the sheer scale of energy consumption in steelmaking and the freight costs embedded in the seaborne iron ore trade.
Copper follows closely, ranging from 0.78 to 0.80, reflecting both the energy demands of smelting and copper’s well-known role as a barometer of industrial activity; when oil prices rise, broader economic activity and metals demand tend to move in tandem.
Meanwhile, prices of metals like Lead, Tin, and Aluminum are all in the mid-tier (0.6-0.7), indicating that an oil shock leads to greater indirect exposure to those metals. Still, the machines that build our world run on oil, and so do the materials they’re made from.
Why rubber prices follow crude
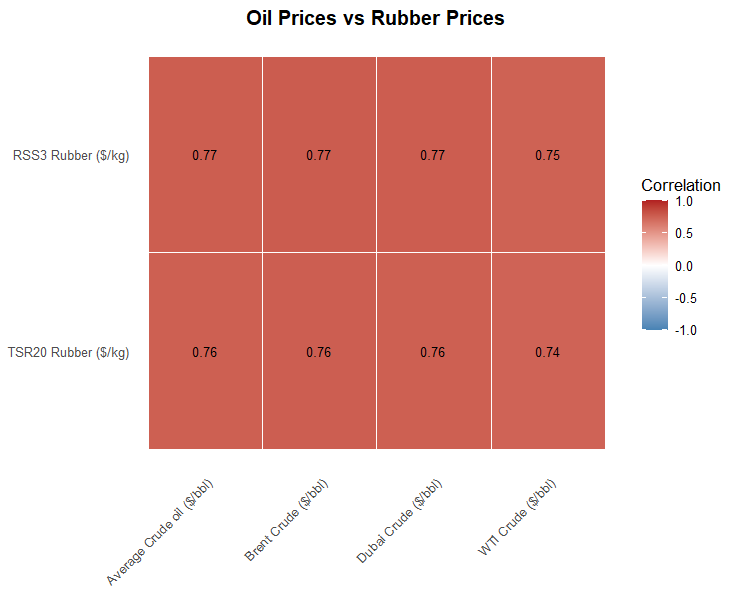
Besides industrial metals, rubber prices and oil prices show a strong correlation to one another, as the World Bank “Pink Sheet” shows that both RSS3 (Ribbed Smoked Sheet 3) and TSR20 (Technically Specified Rubber Grade 20) rubber tracks global oil prices with near-identical consistency, with coefficients of 0.74–0.77 across all crude prices.
The reason for this strong correlation lies in rubber’s most important competitive dynamic: synthetic rubber is derived directly from petrochemical feedstocks like naphtha. When oil prices rise, synthetic rubber becomes more expensive to produce, putting upward pressure on natural rubber prices as buyers shift toward it.
And when rubber prices rise, prices of tires, hoses, waterproof gloves, cable insulators, and footwear rise as well. Even the parts that hold the machines together are priced by the oil.
Timber and the hidden freight cost of oil
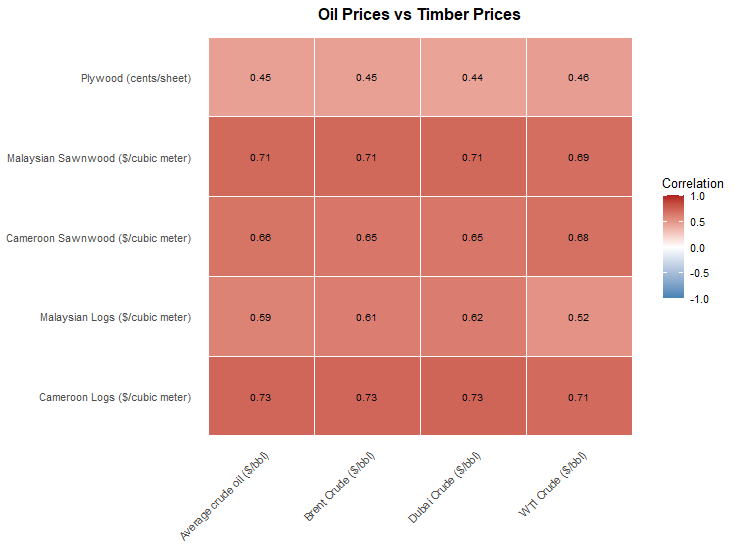
Another commodity tied to oil prices is timber, which is distributed unevenly along the supply chain. The World Bank “Pink Sheet” shows that Cameroon logs lead the group at 0.71–0.73 across all four oil benchmarks, closely followed by Malaysian sawnwood at 0.69–0.71, while Malaysian logs trail at just 0.52–0.62, and plywood sits at the bottom of the matrix at 0.44–0.46.
The divergence between Cameroon and Malaysian logs is geographic: Cameroonian timber travels long distances by sea to European and Asian markets, and as mentioned in the oil and gas derivatives section, the use of heavy fuel oil (HFO) for ocean freight and diesel for logging equipment is directly embedded in the final price. By contrast, Malaysian logs are mostly shipped within Southeast Asia, resulting in shorter freight distances and less heavy fuel oil required.
Sawnwood’s slightly higher correlations with log prices in Cameroon and Malaysia reflect additional processing and transport steps, which require more HFO and increase exposure to oil price swings.
Plywood is the clear outlier, as by the time timber reaches the plywood stage, the dominant cost drivers have shifted away from raw energy toward labor and resin inputs. Plywood is the most processed, regionally priced, and therefore the least oil-sensitive product in the timber supply chain.
What precious metals reveal about oil’s reach
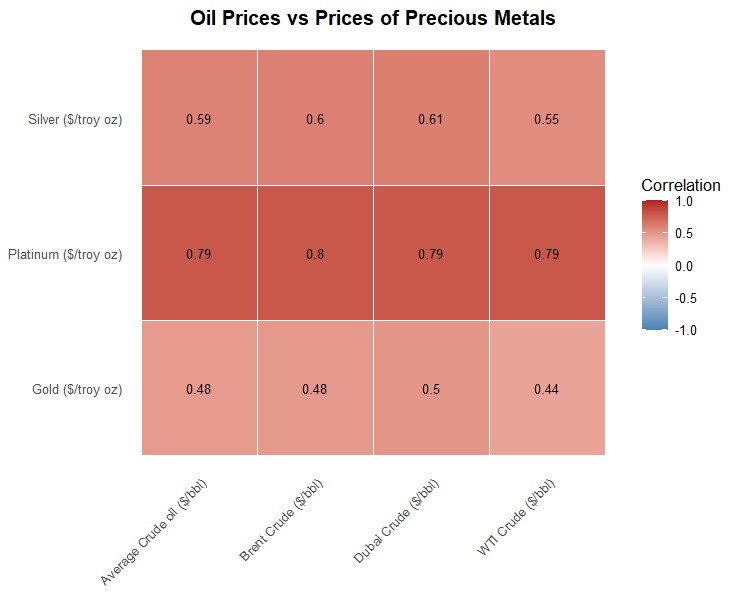
The correlation matrix for precious metals tells a more nuanced story than that for industrial base metals. Data from the World Bank “Pink Sheet” shows that platinum sits firmly at the top, with correlations of 0.79–0.80 across all four oil benchmarks, while silver occupies a middle tier at 0.55–0.61, and gold trails at just 0.44–0.50, showing that different metals play fundamentally different roles in the global economy.
Platinum’s strong links to oil prices are intuitive, as it is both an industrial and a precious metal, consumed in catalytic converters, industrial refining, and chemical manufacturing, all of which are deeply embedded in oil-price cycles.
Silver follows a similar but softer logic. At the same time, it carries a monetary and jewelry premium; its heavy use in electronics, solar panels, and industrial processes means oil-driven cost pressures do leave a meaningful imprint.
Gold’s outlier status (a 0.41-0.44 score) is a reminder that not all prices are governed solely by physical inputs. Sentiment, fear, and geopolitical risk can override energy fundamentals, which matters enormously for the energy transition. The same kind of collective sentiment shift, driven by the escalating reality of climate change, may ultimately prove powerful enough to break the commodity-oil link described throughout this article, as survival instincts override efficiency and the economics change.
Why the oil in your kitchen tracks the oil in the ground
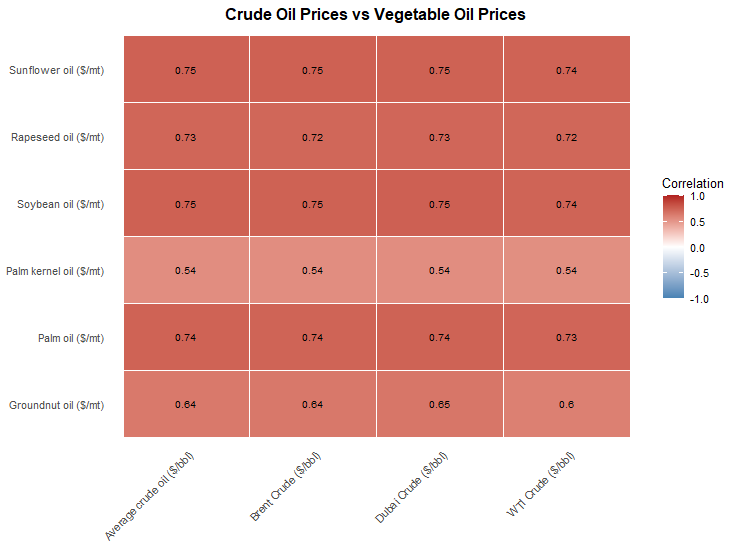
Finally, the correlation matrix for vegetable oils delivers one of the more striking findings in the entire analysis: the oil in your kitchen is priced by the oil in the ground. Data from the World Bank “Pink Sheet” show that sunflower and soybean oils sit at the top of the group with correlations of 0.74–0.75 across all four crude benchmarks, followed by palm oil at 0.73–0.74, rapeseed oil at 0.72–0.73, and groundnut oil as the trailing outlier at 0.60–0.65.
The mechanism behind these correlations is more direct than it appears. Countries like Brazil, Indonesia, and Malaysia, to name a few, have adopted biofuel blend mandates, which drive up demand for Sunflower, soybean, rapeseed, and palm oils. This policy-driven demand channel effectively creates a price floor, tying vegetable oil markets to crude benchmarks with a regularity that no purely agricultural commodity can match.
Meanwhile, palm kernel oil and groundnut oil are notable exceptions at 0.54 and 0.60-0.65, respectively, across all oil benchmarks. In the case of palm kernel oil, its specialized end uses are in cosmetics, detergents, and confectionery fats rather than bulk food or biodiesel markets. Groundnut oil is produced and consumed predominantly in South and West Asia and sub-Saharan Africa, markets with weaker direct exposure to global energy price cycles.
What does all this mean then?
My correlation testing using price data from the World Bank Pink Sheet confirms it: crude oil’s reach extends far beyond the fuel pump. Through fractional distillation, a single barrel yields naphtha for plastics and synthetic rubber, petroleum coke for metal smelters, and heavy fuel oil for global shipping.
Conducting a correlation test using price data from the World Bank Pink Sheet confirms this, as industrial metals, rubber, timber, precious metals, and vegetable oils all move with crude prices in one way or another.
The energy transition cannot fully escape this dependency in the short term, as building batteries, wind turbines, and solar panels still requires energy-intensive mining, smelting, and shipping.
But dependency is not destiny, as technological progress, policy intervention, and the growing weight of climate-driven public sentiment are already beginning to erode the structural links documented here. The question is not whether the world will move beyond oil, but how fast, and at what cost.
Editor’s Note: The opinions expressed here by the authors are their own, not those of impakter.com — In the Cover Photo: Barrels of oil. Cover Photo Credit: Alimurat Üral