Editor’s Note: This piece is co-authored by Lucas Chancel, Tancrede Voituriez and Alex Hough.
Income and wealth inequality are rising in most countries around the world today. Recognizing that this challenge has become a universal issue, in 2015, the United Nations agreed to seventeen Sustainable Development Goals (SDGs), and specifically to SDG Target 10 committing countries to ‘reduce inequalities within and among countries’.
So far, country responses have been sporadic and inconsistent, even in the very countries, that were the more vocal advocates of the inclusion of domestic inequality reduction in the new global Agenda. There has been little articulation about what Target 10 means in terms of national-level implementation. The lack of appropriation is a missed opportunity, in particular for European countries which face the pressing need to both impose their hallmark on the Agenda 2030, and to curb rising inequality at home in countries stuck in the grip of populist extremism. Along with climate action, domestic inequality reduction could be the distinctive priority of the EU both at home as well as in its development and cooperation policy.
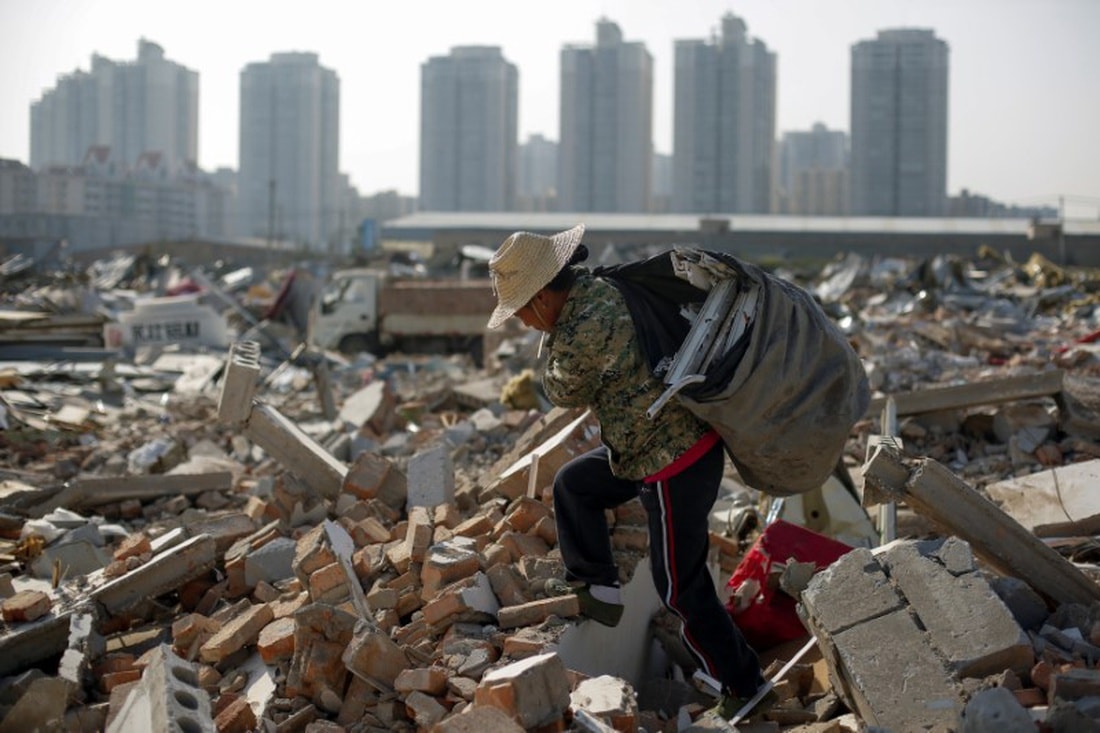
In the Photo: Migrant worker Photo Credit: Elias Glenn Natalie/Thomas Reuters
How Domestic Inequality has Become a Universal Issue
After decades of divergence across countries per capita income, there is evidence of convergence at the global level since the 1990s, and in particular since the 2000s, while domestic inequality are conversely on the rise. Drawing on the new World Wealth and Income Database database, we present the evolution of top 1 percent income shares – a telling metric of inequality – in developed economies and developing economies alike. The extent of the increase varies across countries, but in nearly all nations, the general tendency is one of rising top 1 percent income shares since the late 1970s (figure 1). In the USA, top 1 percent fiscal income share was close to 10 percent forty years ago, and is now above 20 percent. Over the same period, top 1 percent fiscal income share increased from 6.5 percent to 13 percent in China (figure 2).
In this context, the unanimous endorsement of SDG Target 10.1 by the UN Member States marks an important shift. Target 10.1 explicitly includes domestic inequality reduction in the global development agenda. It states: ‘By 2030, progressively achieve and sustain a reduction in income inequality, as measured by the share of the bottom 40 percent of the population in national income, alongside economic growth’.
Top 1% National Income Share in Rich Countries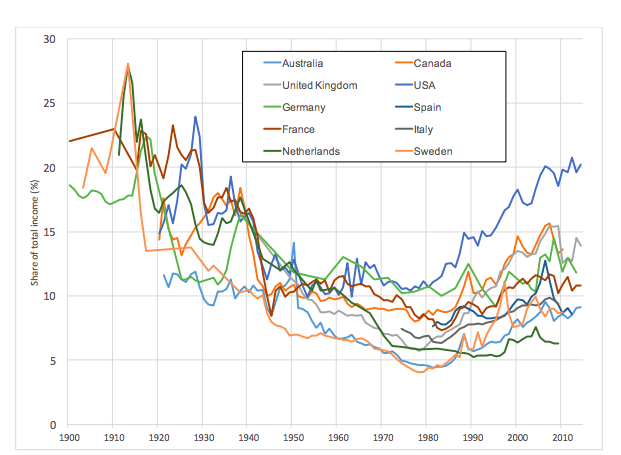
Source: WID.world Note: This figure displays the evolution of the share of national income accruing to the top 1% earners in rich countries. In the USA the top 1% earners captured 20% of national income in 2014.
Top 1% National Income Share in Emerging Countries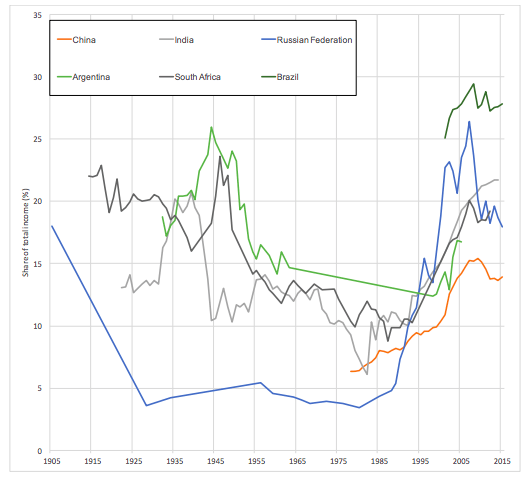
Source: WID.world Note: This figure displays the evolution of the share of national income accruing to the top 1% earners in emerging countries. In India the top 1% earners captured 22% of national income in 2014.
The target was the subject to harshly contested debates in the Open Working Group. There were calls for a target for reducing income inequality within countries, measured by the Gini coefficient or the Palma index. Meanwhile, the report of the High-Level Panel argued against a target for addressing domestic income inequality on the grounds that ‘countries differ widely both in their view of what levels of income inequality are acceptable and in the strategies they adopt to reduce it.’ Several countries such as the USA and Canada contended that a stand-alone goal on inequality could ‘lead to a sterile debate’ and that domestic inequality reduction would better be achieved through other goals such as economic growth or a fair access to productive assets. Other countries like China and Indonesia argued that within-country inequalities objectives tended to place a higher burden on developing countries than on OECD economies, and that ‘promoting equality should not be a standalone goal area.’
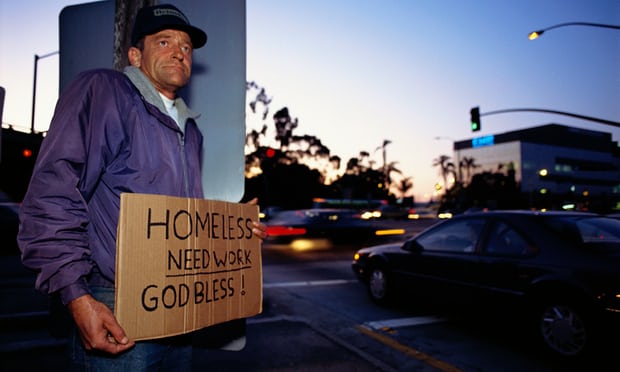
In the Photo: A homeless man stands on a street corner. Photo Credit: Joel Stettenheim/CORBIS
After the target was removed from the draft-list in the course of 2014, a group of countries led by Denmark, Norway, and Brazil supported its re-inclusion. Denmark, along with Norway, argued that the rise in inequalities found its roots in ‘exclusive growth’ and that a specific metric should be used to ensure that growth resorbs inequalities rather than triggers them. As for Brazil, while stressing the need to reduce between-country inequalities, it also supported the inclusion of domestic inequality reduction targets. This second group of countries was successful in including the domestic target in the final list, after campaigns from NGOs and lobbying from influential academia such as J. Stiglitz.
Leveraging SDG 10 in National Politics
A common set of 230 indicators were agreed on in 2016 at the UN level as the backbone of monitoring the SDGs at local, national, regional, and global levels. They serve as a management tool to help countries develop implementation strategies and allocate resources accordingly, and as a report card to measure progress towards achieving a target and to ensuring the accountability of governments and other stakeholders for the implementation of the SDGs.
The additional value of the SDGs, in this context, is to provide a common, universal metric. The metric carries particular weight as it has been unanimously endorsed by the UN Member States. That being said, the metric for measuring inequality in Target 10.1 has potential descriptive drawbacks. By ensuring that the bottom 40 percent do not lose out, the target clearly reflects the SDG principle to ‘leave no one behind’. However, the indicator is blind to changes at the apex of the distribution (in situations where top earners’ and bottom earners’ incomes grow while the middle shrinks, for instance). This amounts to more than an innocuous oversight. Rising top income shares drove income inequality dynamics in the past decades.
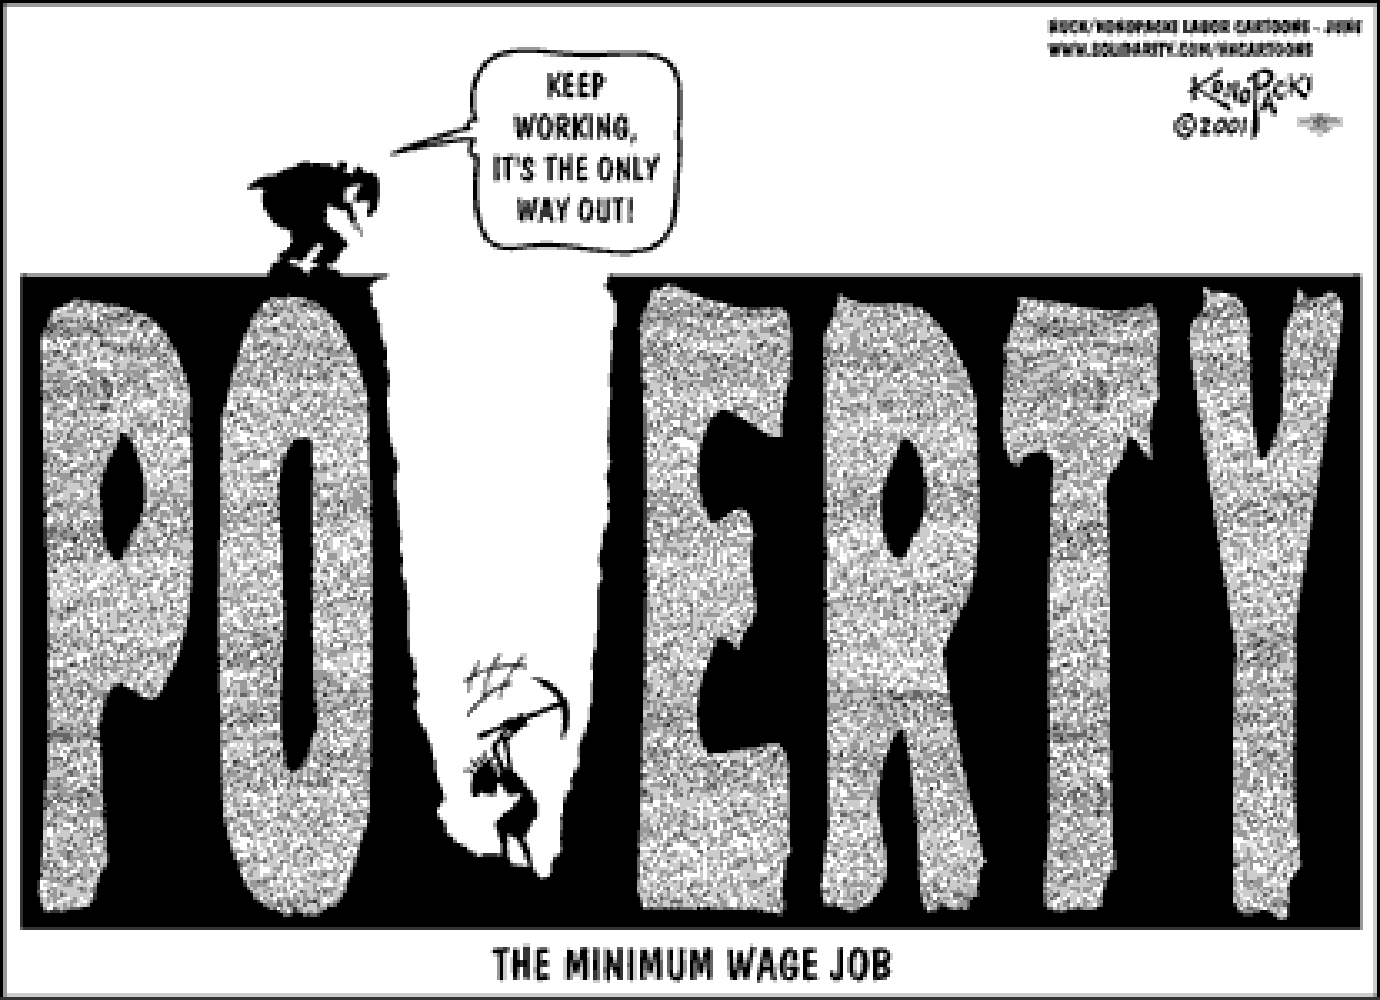
Photo Credit: Keep Working by Mike Konopacki
Table 1 shows the performance of three countries (China, France, USA) on the SDG target, over the past 15 years (2000-2015 period) and in the longer run (1980-2015, time span with available and comparable data). All three countries considered failed to meet the SDG target 10.1. Still, the target remains feasible. France came very close to achieving the target over the 1980-2015 period, for example. In France, over the 1980-2015 period, the bottom 40% is not far from average growth but the top 0.1% earners enjoy a growth rate that is more than five times higher. In China and the USA as well, the gap between average growth rate and top 0.1% income growth rate (respectively 776 % vs. 2271% and 70% vs. 343% for the 1980-2015 time period) shows the need to complement the bottom 40% target.
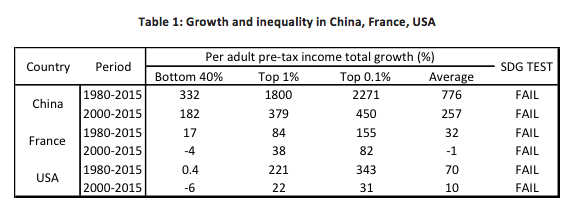
Data source: WID.world (2017). Note: growth in pre-tax per adult income. Authors’ computations. Key: Average per adult income of the bottom 40% group increased by 332% in China over the 1980-2015 period. Average per adult growth rate was 776% over the period. All figures are net of inflation.
We therefore suggest that countries interested in inequality reduction employ a complementary statistic, comparing, when available, the evolution of top incomes (top 1% or top 0.1% income shares) to average growth, in order to capture important changes at the apex of the income distribution. The use of complementary metrics, in addition to the global indicators list adopted by the General Assembly, is explicitly foreseen in the SDG framework. Paragraph 75 of Transforming Our World: The Agenda 2030 for Sustainable Development states:
“The Goals and targets will be followed-up and reviewed using a set of global indicators. These will be complemented by indicators at the regional and national levels which will be developed by member states, in addition to the outcomes of work undertaken for the development of the baselines for those targets where national and global baseline data does not yet exist”.
The inclusion of complementary statistics is voluntary, based on the discretion of states. In this case, epistemic communities have already contributed a great deal: data about the income and wealth of the top 1% produced by academia and civil society have been harnessed by activists and NGOs to increase awareness in the issue of rising inequality. The uptake of this complementary indicator will therefore depend on the continued participation of civil society actors and academia.
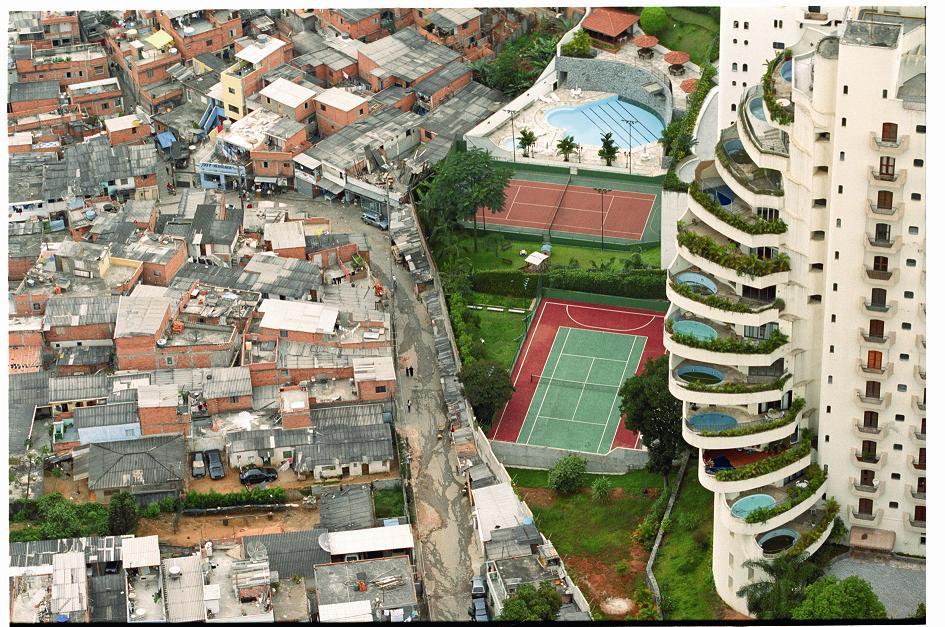
In the photo: Favela de Paraisópolis (swimming pools). This favela on the left is ironically called Paraisópolis (Paradise city). Photo Credit: Tuca Vieira
Ranking Countries to Trigger Policy Reaction
The SDG indicators not only provide a harmonized metric, they also sets a threshold for the income growth of the bottom 40 percent. The monitoring is carried out through an annual reporting system, under the aegis of the UN Secretary General, based on indicators and national statistics. Nothing in Target 10.1 constrains the speed of inequality reduction, nor the optimal range of outcomes that countries should aim to achieve. Nevertheless, to reach the target, several countries in the developed and developing world will have to invert current inequality trends. Could ranking help decision makers tackle the problem seriously?
The example of the Programme for International Student Assessment (PISA) of the OECD is illuminating. PISA’s influence on education policy is maximised when stakeholders recognize the indicators as legitimate, when monitoring and reporting mechanisms are in place—as planned in the 2030 Agenda—and when evaluation results are disseminated to the media. The political appeal of ranking is particularly striking during national election campaigns – at least among EU 27 countries. In particular, GDP growth, unemployment rate and public spending as a share of GDP have pervaded across continental Europe in national debates on welfare state reforms over the last two decades. Beyond-GDP-indicators which have been developed and included in the national jurisdiction of a few countries rest on a similar rationale of country-to-country comparison. The interactive OECD Better Life Index tool, for instance, enables people “to express what matters most to them (…), share and compare their answers with people across 38 OECD member and non-member countries” (OECD, 2016).
Practically, ranking countries could be done by comparing the year-on-year difference between the annual growth rate of the average income per capita and the annual growth rate of income per capita among the bottom 40 percent on a country basis. Countries with the highest difference would rank highest.
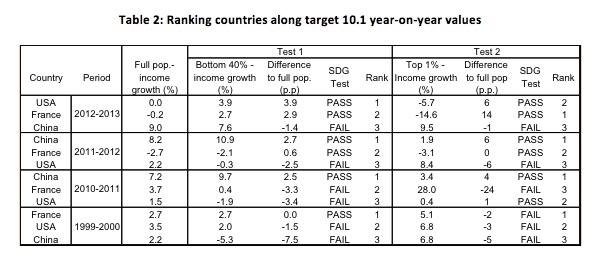
Data source: WID.world (2017). Income growth rates correspond to real per adult pre-tax national income. Figures corrected for inflation. Authors computations.
Table 2 encapsulates year-on-year values of target 10.1 and top 1 percent per adult pre-tax income growth for China, France and the US, from 2010 to 2013 (last available year-on-year WID.world data) and for year 1999-2000. It provides four snap-shots of countries’ performance on the official (bottom 40 percent, “Test 1”) and complementary (top 1 percent, “Test 2”) inequality targets and makes a ranking of countries along the bottom 40 percent income convergence speed, as well as along the gap between average and top 1 percent growth. Looking at what we dub the Test 1, China ranked first in 2011 and 2012 and passed the SDG test, but failed in 2013. The other way round, the US failed in 2011 and 2012 but toped in 2013, displaying sharp year-on-year changes in inequality pattern. Test 2 shows that the ranking of countries can be modified when focusing on top 1 percent income growth rather than bottom 40 percent. In 1999-2000 for instance, France passes Test 1 but fails on Test 2.
Country ranking would be technically feasible thanks to national statistical reports on SDGs. We must be clear however that it remains politically tricky. Ranking countries according to their performance in achieving specific goals and targets is very unlikely to become part of the mandate of the UN High Level Political Forum (HLPF). This ranking could be produced instead by coalitions of Think Tanks, research institutions and civil society organizations (CSO) outside of the UN system. Some initiatives are underway. Taking a comprehensive approach of the SDGs, the SDSN has developed a SDG index and dashboard for country ranking. The Migration and Development Civil Society Network (MADE) in cooperation with Cordaid has drafted Proposals for Shadow Reporting on SDG implementation. Transparency International issued a methodological Note for SDG shadow reporting questionnaire to “help assess progress towards three SDG targets linked to anti-corruption and government transparency” and make comparisons across countries. In this context there both a clear need and a space for inequality ranking across countries that could be filled by the economic inequality and environmental inequality communities together.
Conclusion
Rising economic inequality within countries is a defining challenge of our time. A growing body of literature highlights the negative impacts of domestic inequality on a wide number of political, social, economic and environmental problems – thus making of domestic inequality a key sustainable development challenge. However, over the past decade, despite growing concern, debates have not been converted into action and domestic inequality keeps rising.
The inclusion of inequality within the Sustainable Development Goals framework shows that the international community is now willing to tackle this problem. The SDGs provide several levers to turn the global inequality debate into action: a common metric, peer pressure through a ranking of countries, and mutual learning of policies. The contribution of SDGs to each of these levers is of course unequal, yet significant enough for SDG 10 to be considered seriously in national debates on inequality. While the common metric exists, only significant involvement from civil society and commitment from governments will make it possible for peer pressure and learning to become effective.
Co-Authored By:
 Lucas Chancel
Lucas Chancel is Co-Director of the World Inequality Lab at the Paris School of Economics and Senior Research Fellow at the Institute for Sustainable Development and International Relations. He also teaches at Sciences Po.

Alex Hough
Researcher at Institute for Sustainable Development and International Relations (IDDRI). Alex has a Master’s degree in international development from Sciences Po’s Paris School of International Affairs. His research interest is in inequality and global governance.