

Most retail data analytics work ends in a ranked list. Whatever the question was, the deliverable is a table sorted descending, and the row at the top gets the investment.
The habit is understandable. It is also how categories end up crowded at the centre and empty at the edges. Ranking by size systematically rewards whatever was already large, which means the top row of your table is often the least informative row in it.
One snack category shows the mechanism clearly.
The category
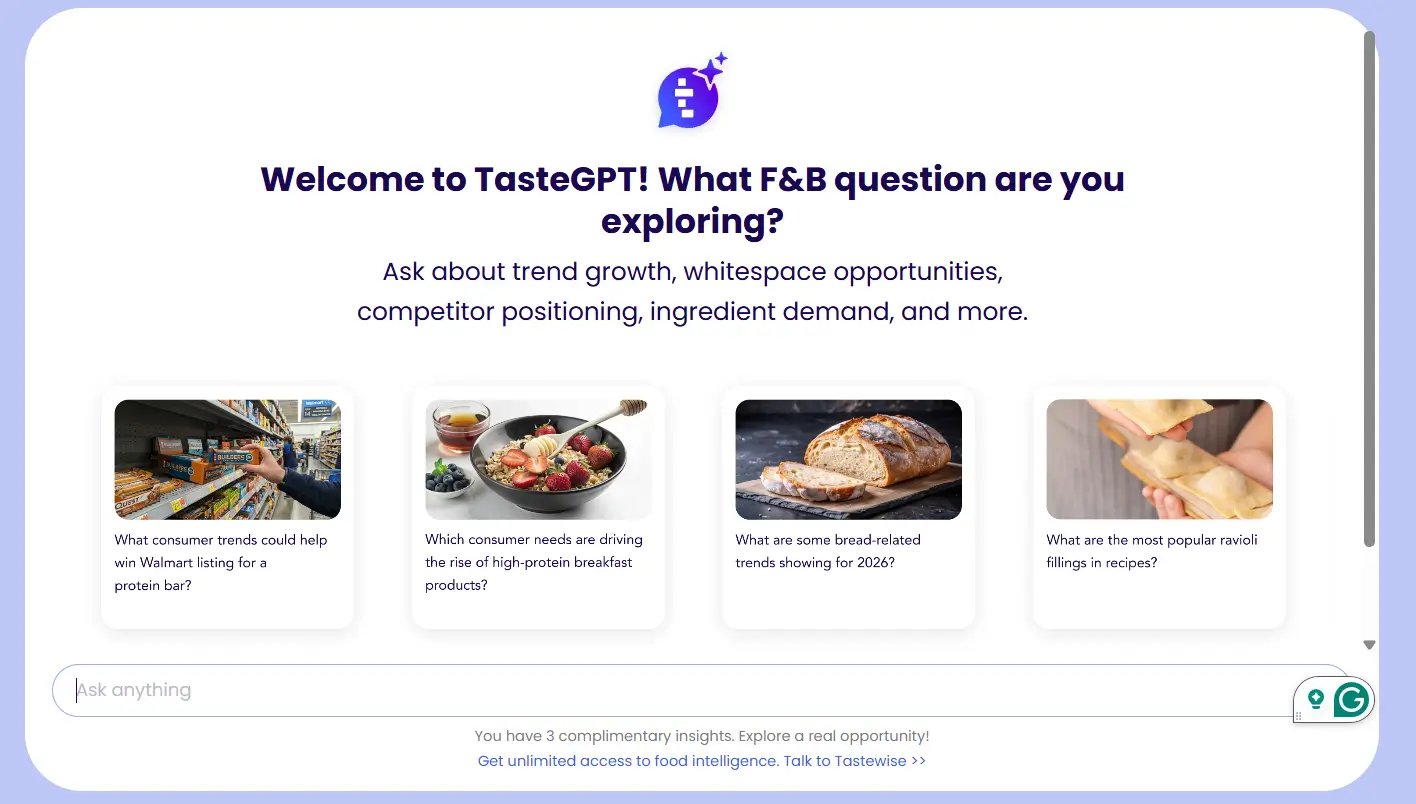
Protein snacks, US market, as of August 2026. The figures come from Tastewise, whose ai assistant for food industry teams reads consumer conversation and menu presence in the same query. That pairing matters for what follows, because the argument depends on holding two measures side by side.
Rank the category by share of consumer conversation and coffee comes first, at 8.76%. Potato follows at 3.28%. Popcorn, cheesecake and donut cluster behind them.
A category plan built on that table puts money into coffee.
Why the top row is usually noise
Now add association strength. It measures how specifically an ingredient belongs to this category, against how often it appears in food generally.
Coffee scores 1.1. Potato scores 2.4. Popcorn scores 5.2.
Egg bites, sitting at 1.99% of conversation, score 148.3. Meat sticks, at 1.33%, score 97.3. Oat flour, at 0.86%, scores 53. Fruit yogurt scores 27, proffee scores 32.8.
Coffee is enormous in this dataset because coffee is enormous in every dataset. Its presence tells you almost nothing about protein snacking. Egg bites are small in absolute terms and almost entirely specific to it. The second group is the category. The first group is background.
Rank by size and you fund the background.
The supply check that changes the plan
Association alone still leaves you exposed, because a distinctive ingredient can already be fully served.
Egg bites carry a menu share of 33.85% in this category. That pairing is not an opportunity, it is a standard. Any brand entering there is entering a fight already in progress against operators with scale.
Meat sticks carry a menu share of 2.03% against their 97.3 association score. Same specificity, a fraction of the supply. Pretzels, growing at 21.06% annually, carry a menu share of 0.12%. Black pepper, growing 27.51%, carries 0.43%.
The plan that comes out of holding association and supply together looks nothing like the plan that comes out of the volume table. It points at pretzels, meat sticks and black pepper, three rows that a size-ranked report would have buried.
Three rules for a retail analytics report
The correction is procedural, and it fits inside whatever stack you already run.
Rank by specificity, then filter by supply. Sort on association strength to find what belongs to your category, then remove anything already carrying high menu or shelf presence. What survives is the shortlist.
Read annual and monthly movement together. Annual figures average twelve months and flatten recent inflection. In this category, peach shows 9.69% annual growth with 3.8% monthly movement, which means most of the year’s change is recent. Pretzels show 21.06% annual with negative monthly movement, which means the opposite. Those two rows need different decisions.
Report the declining list to the same standard as the growth list. Category reviews are commissioned to find opportunity, so decline gets a footnote. That is backwards for anyone holding shelf space, because the fastest available margin gain is usually removing a claim the market has left behind.
Why this keeps happening
The volume habit persists because volume is the easiest measure to collect and the easiest to present. Association scoring needs a dataset that knows what an ingredient normally co-occurs with. Supply comparison needs menu or shelf data joined to consumer data. Both are harder to assemble than a mention count, so plenty of analytics work quietly stops at the mention count.
When retailer websites present different information by location, analysts may use static residential proxies to collect public, region-specific data through a consistent local IP address.
The gap shows up months later, in a launch that landed in a crowded space with a claim everyone else already had. At that point the report was not wrong. It answered the question it was given, which was which row is biggest.
Ask a better question and the same data starts pointing somewhere useful.
Frequently asked questions
What is retail data analytics? Retail data analytics is the practice of joining sales, shelf, consumer and category data to support decisions about assortment, pricing and promotion. In food and drink it increasingly includes menu data, because foodservice adoption often leads retail demand.
Why is ranking by volume a problem in category analysis? Volume rewards whatever is already common across all categories, so the largest rows are frequently generic. Association scoring shows what belongs specifically to your category, and that is where distinctive products come from.
Can an AI assistant do retail category analysis? It handles the descriptive layer well, covering what is growing, what is specific to the category and what supply already exists. An assistant such as TasteGPT answers those on demand. Decisions on assortment and pricing still need a human with commercial context.
Editor’s Note: The opinions expressed here by the authors are their own, not those of impakter.com