
This article begins by reviewing the EU-28 Member States’ public debt, focusing on debt-to-GDP ratios above 60 percent of GDP in 2018. The next step is to analyze the increase in the government debt-to-GDP ratio between 20o8 and 2018 in the Member States that fail to comply with the Maastricht Treaty’s 60 percent debt limit criteria. Finally, in these Member States, the causes of the increase in the government debt-to-GDP ratio are analyzed to determine whether they result from supporting social and pro-humanitarian causes. People at risk of poverty or social exclusion index have been used as a reference point to gauge social and pro-humanitarian causes.
Graph A
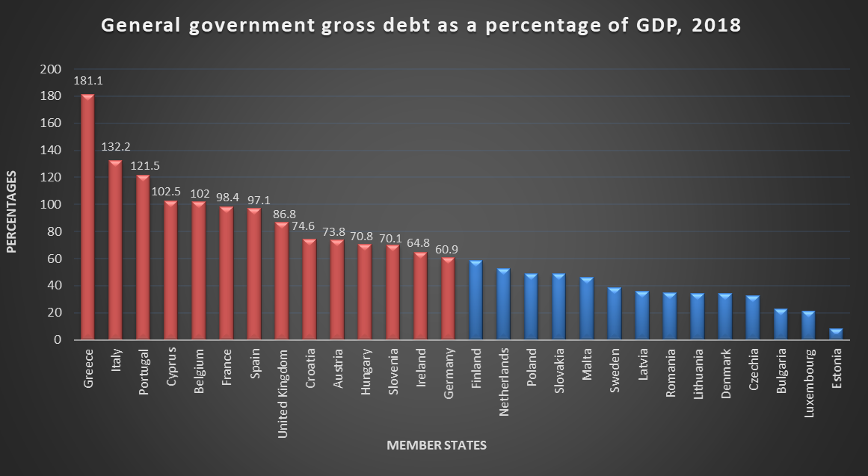
The highest government debt-to-GDP ratios were recorded by Greece (181.1%), followed by Italy (132.2%), Portugal (121.5%), Cyprus (102.5%), Belgium (102%), France (98.4%) and Spain (97.1%). Also, it must be noted that these 14 EU Member States have maintained a government debt-to-GDP ratio above 60% of GDP during the years 2014-2018.
Graph B
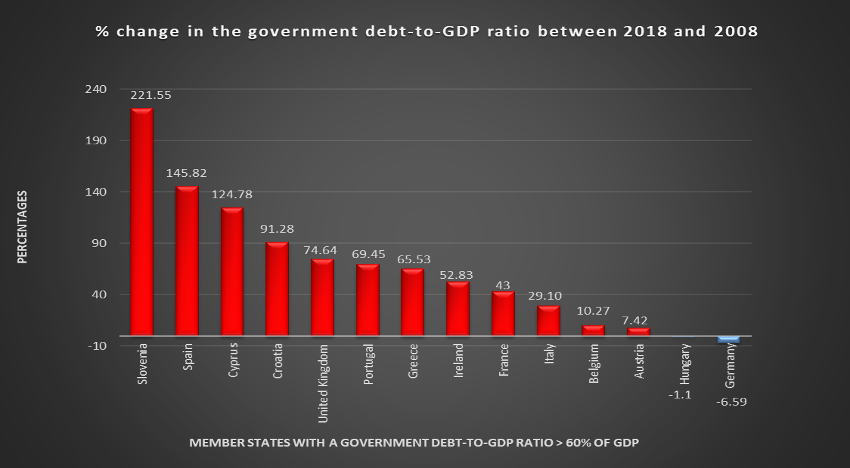
For these 14 Member States, Graph B shows the percentage change in the value of the government debt-to-GDP ratio in 2018 compared to 2008. We see that, except Hungary and Germany, all of them have experienced a percentage increase in the government debt-to-GDP ratio.
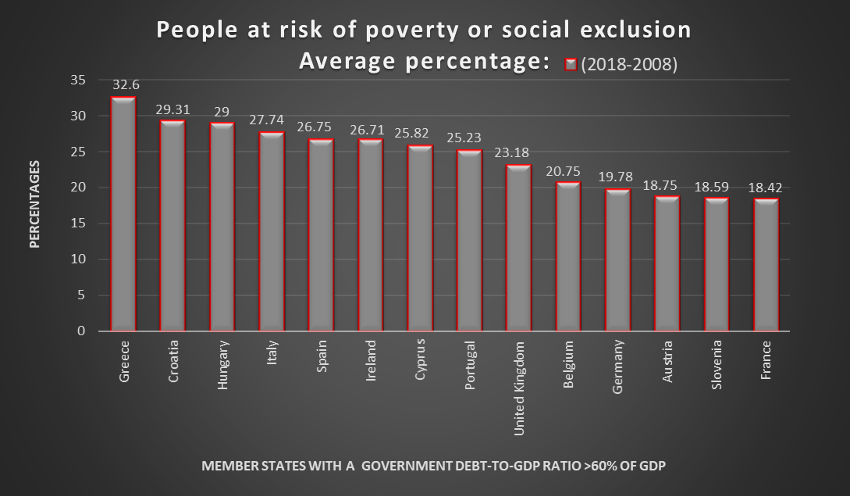
Continuing with the analysis of these 14 Member States, Graph C shows the average percentage of people at risk of poverty or social exclusion in the period 2008 to 2018.
Graph C
Ironically, before the 2008 economic-financial crisis, these two countries were among the lowest sovereign debt levels in Europe. So, for example, in 2007, the ratio of public debt/GDP in Spain was 35.6% and Slovenia 22.8%. It must be emphasized that the sharp rise in the government debt-to-GDP ratio in both countries is a result of a remarkable bank recapitalization.
This is a well-known story. In the years prior to the crisis of 2008, the construction sector became the main driver of economic growth, employment, and tax revenues in both economies.
Banks stimulated the demand with high loan-to-value (LTV) mortgages to borrowers for housing, 80%, and in some cases 100% LTV. And, of course, obviously, as a result of the crisis property prices started to fall, and the banking and finance sector suffered heavy loan losses.
In this context, both Member States carried out a banks’ recapitalization process, taking charge of the bad loans, and thus absorbing high capitalization costs which led to a sharp rise in gross government debt. Therefore, the increased value in the government debt-to-GDP ratio over the period 2008 to 2018 was not attributable to support of social causes, but the consequence of a speculative model whose main characteristic is a bubble-based economic growth.
This type of socio-economic behavior meant cutbacks of the public money for development and welfare. As we can see in Graph C, between the period 2008 until 2018, the index measuring people at risk or social exclusion has remained high, presenting on average 26.75% for Spain and 18.59% for Slovenia.
As shown in Graph B, Cyprus and Croatia occupy the third and fourth place in the rising government debt-to-GDP ratio when comparing the government debt-to-GDP ratios’ values in 2018 with those of 2008. This means an increase of 124.78% for Cyprus and 91.28% for Croatia.

For Cyprus, the cause of the rising public debt levels was a result of a bank recapitalization. Cyprus had to bail out its banks with the aid of the EU funds and the IMF. This situation increased the country’s government debt. The country’s major banks were highly exposed to Greek debt and, consequently, the write-down of Greek debt caused them a lot of damage.
In the case of Croatia, there was an intensive government indebtedness to undertake large infrastructure projects. After the 2008 economic-financial crisis and during the following years of recession, we are in a context of weak economic growth and lower budget revenues, leading to the rapid growth of public debt and a rise in the government debt-to-GDP ratio.
In this macro scenario, there is a critical issue of country vulnerability as a large share of the public debt is denominated in foreign currency exposing it to foreign currency risk. Therefore, I consider that in the period analyzed, a key factor in the rising public debt level was a result of downward pressures and weakening of its local currency.
So here also, as shown in Graph C, we do not see that the increased level of government debt was useful for (or the result of) supporting social purposes. For the period from 2008 to 2018, the index measuring people at risk or social exclusion registered an average of 25.82% for Cyprus and 29.31% for Croatia.
As can be seen in Graph B, during the period from 2008 to 2018, the United Kingdom, Portugal, Greece, and Ireland experienced an increase in the government debt-to-GDP ratio of 74.64%, 69.45%, 65.53%, and 52.83%, respectively. In these countries, the sharp increase in the ratio has different causes.

So, for example, Portugal, before the 2008 economic-financial crisis, suffered a combined effect of weak economic growth and cheap credit expansion to the private sector. Between 2008 and 2014, it experienced an economic crisis characterized mainly by falling GDP, banks recapitalization as a result of non-performing loans, and reduction in the tax revenues.
This macroeconomic context contributed to higher government debt levels and the rise in government debt-to-GDP ratio. In others, such as Ireland and the United Kingdom, as Spain and Slovenia, the main causes for increasing public debt followed a similar pattern.
Thus, in the first phase, there is a real estate boom based on bank loans. As a result, home prices increase, giving rise to property bubbles. In 2008, the economic collapse bursts the property bubbles, and banks are not able to recover the full amount of the money they had lent. Finally, the governments step in to bail out banks and this remarkable bank recapitalization led to a strong increase in government debt level.
As for France, Graph B shows a 43% increase in the government debt-to-GDP ratio in the period analyzed. On the explanation of the rise in public debt and the consequent rise in the government debt-to-GDP ratio, I see the point of view offered in this report as very appropriate. I think that many of its conclusions can be extrapolated to other European countries. France, registering an average of 18.42%, has the lowest value in the index measuring people at risk or social exclusion, as seen in Graph C.
As shown in Graph C, for Ireland, Portugal, and the United Kingdom, the index measuring people at risk or social exclusion registered an average of 26.71%, 25.23%, and 23.18%, respectively. We are once again seeing that the increase in sovereign debt in these Member States was not the result of supporting social causes.
Regarding Greece, I believe that the main causes of the increased level of government debt can be attributed to the inaccurate information provided to secure its position in the eurozone, rather than to blame it for an excessive expenditure, high government salaries, protectionism…In fact, in the period 2008-2018, Graph C shows that Greece registering an average of 32.6 % heads the ranking in measuring people at risk or social exclusion index.
Graph B shows that Italy with 29.10%, Belgium 10.27%, and Austria 7.42% are the Member States that experienced the lowest increase in the government debt-to-GDP ratio when comparing the values in 2018 with those of 2008. These countries have similarities in their sovereign debt dynamics in that period.
All of them show an increase in sovereign debt generated as a result of measures taken to support the banking sector and a slowdown in the GDP growth rate. A clear example is the combination of slower GDP growth and rising public debt to provide financial support to Austria’s banking system. Belgium and Italy present a similar dynamic of poor growth performance and troubled banks with NPLs.
In addition, political instability experienced by both countries between 1970 and 1990 contributed to the accumulation of high public debt levels. With respect to Italy, it must be pointed out that before the crisis of 2008, it showed the highest ratio of non-performing loans (NPLs) among the countries of the eurozone.
As in all other such previous cases, the increase in sovereign debt in these Member States did not originate as a result of supporting social improvements. As the Graph C shows, the average percentages of people at risk of poverty or social exclusion in the period 2008-2018 for Italy, Belgium and Austria are 27.74%, 20.75%, and 18.75%, respectively.

Concluding Observations:
Consistent with all the above, bank recapitalization was a key factor that led to a drastic increase in sovereign debt. It should be stressed that the sovereign debt created as a result of the banking sector recapitalization is financed from public funds, which implies a trimming for the development and welfare of people.
It is a well-known and elementary cycle, Member States bail out banks, as a result, sovereign debt soars, and government bonds yields go up. Subsequently, in order to reduce the government bonds yields (cost of public debt) and interest rates, ECB buys government bonds to inject liquidity into the economy through a program known as Quantitative Easing (QE).
Furthermore, strict austerity measures and structural reforms are imposed to decrease the government deficit and debt. Austerity measures lead to a socio-economic deterioration (higher unemployment rates, greater tax burden on households, drastic spending cuts in healthcare, social care, education…, drop in consumer spending…) and the government debt-to-GDP ratio worsens.
Now, taking all the above into account, I wonder whether a high public debt is really just a financial problem. Arguably, it looks like a necessary component of economic behavior and social lifestyle, which eventually evolves into a control political tool over the highly indebted Member States. The question is out.