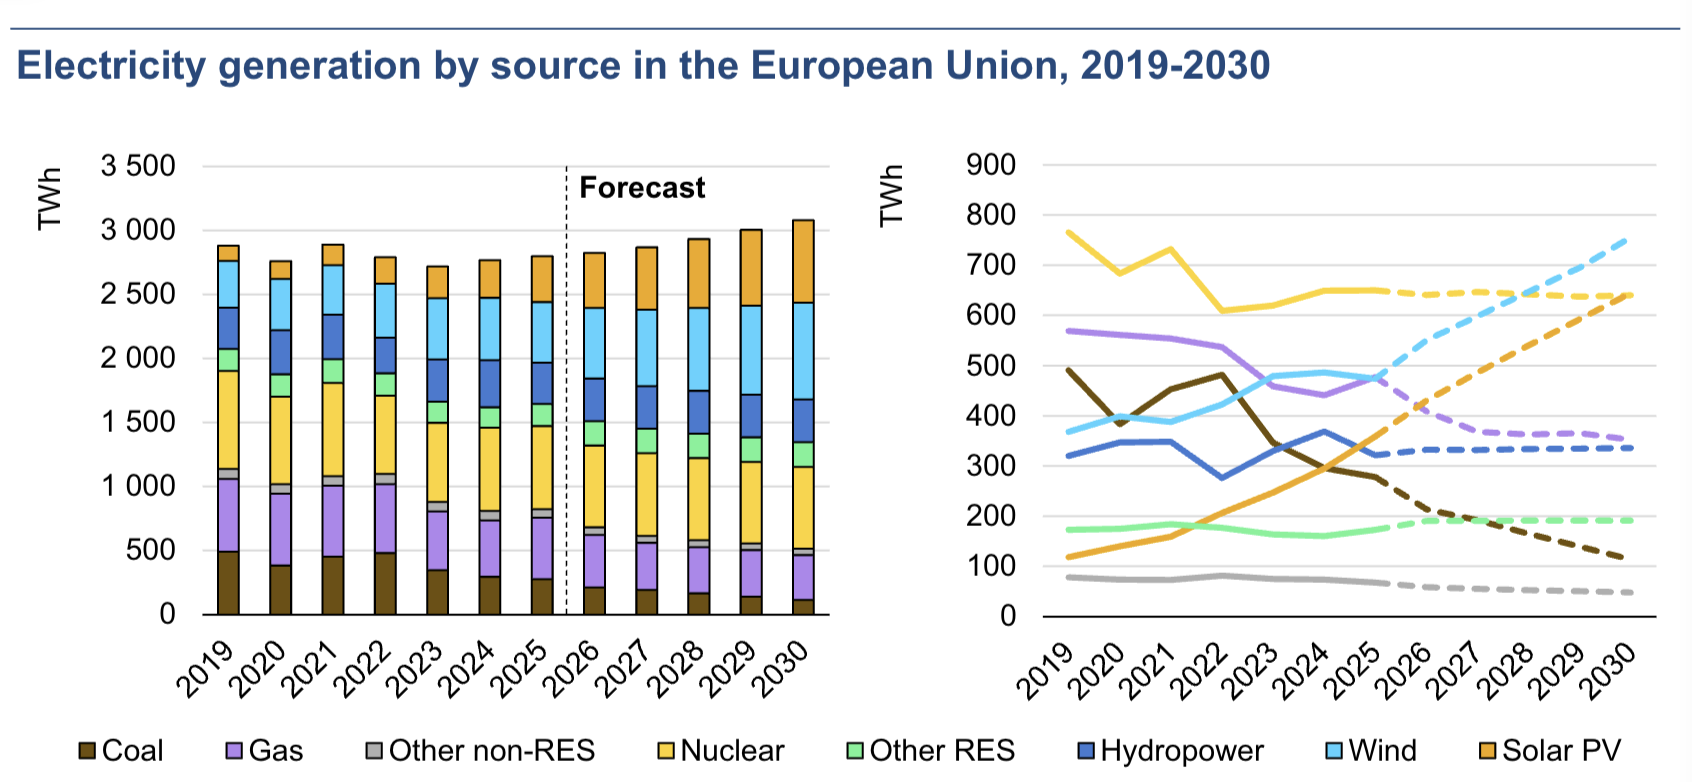
The latest International Energy Agency (IEA) annual report on electricity forecasted that by 2030, 50% of global electricity will come from low-emission sources — renewables and nuclear combined. The renewable energy sources include hydropower, wind, and solar. Despite this positive trend, coal and gas remain the most popular sources of electricity, and they will continue to be through 2030. According to the IEA, renewable output is projected to increase by around 1,000 terawatt-hours (TWh) annually through 2030, with solar energy accounting for over 60% of the increase.
On an annual basis, renewable generation is forecast to increase at an 8% rate between now and 2030. In 2025, renewable generation rapidly increased, nearly matching coal-fired generation levels, despite weaker hydropower output and lower wind speeds in some regions. The main question is whether the IEA report forecasts a structural change or a continuation of an existing trend.
Growing demand for electricity
Global electricity demand is forecast to increase at an average annual rate of 3.6% over the 2026-2030 forecast period, up from 2.8% over the last decade. The annual demand growth over the next five years (2026-2030) is expected to be 50% higher on average than during the previous decade.
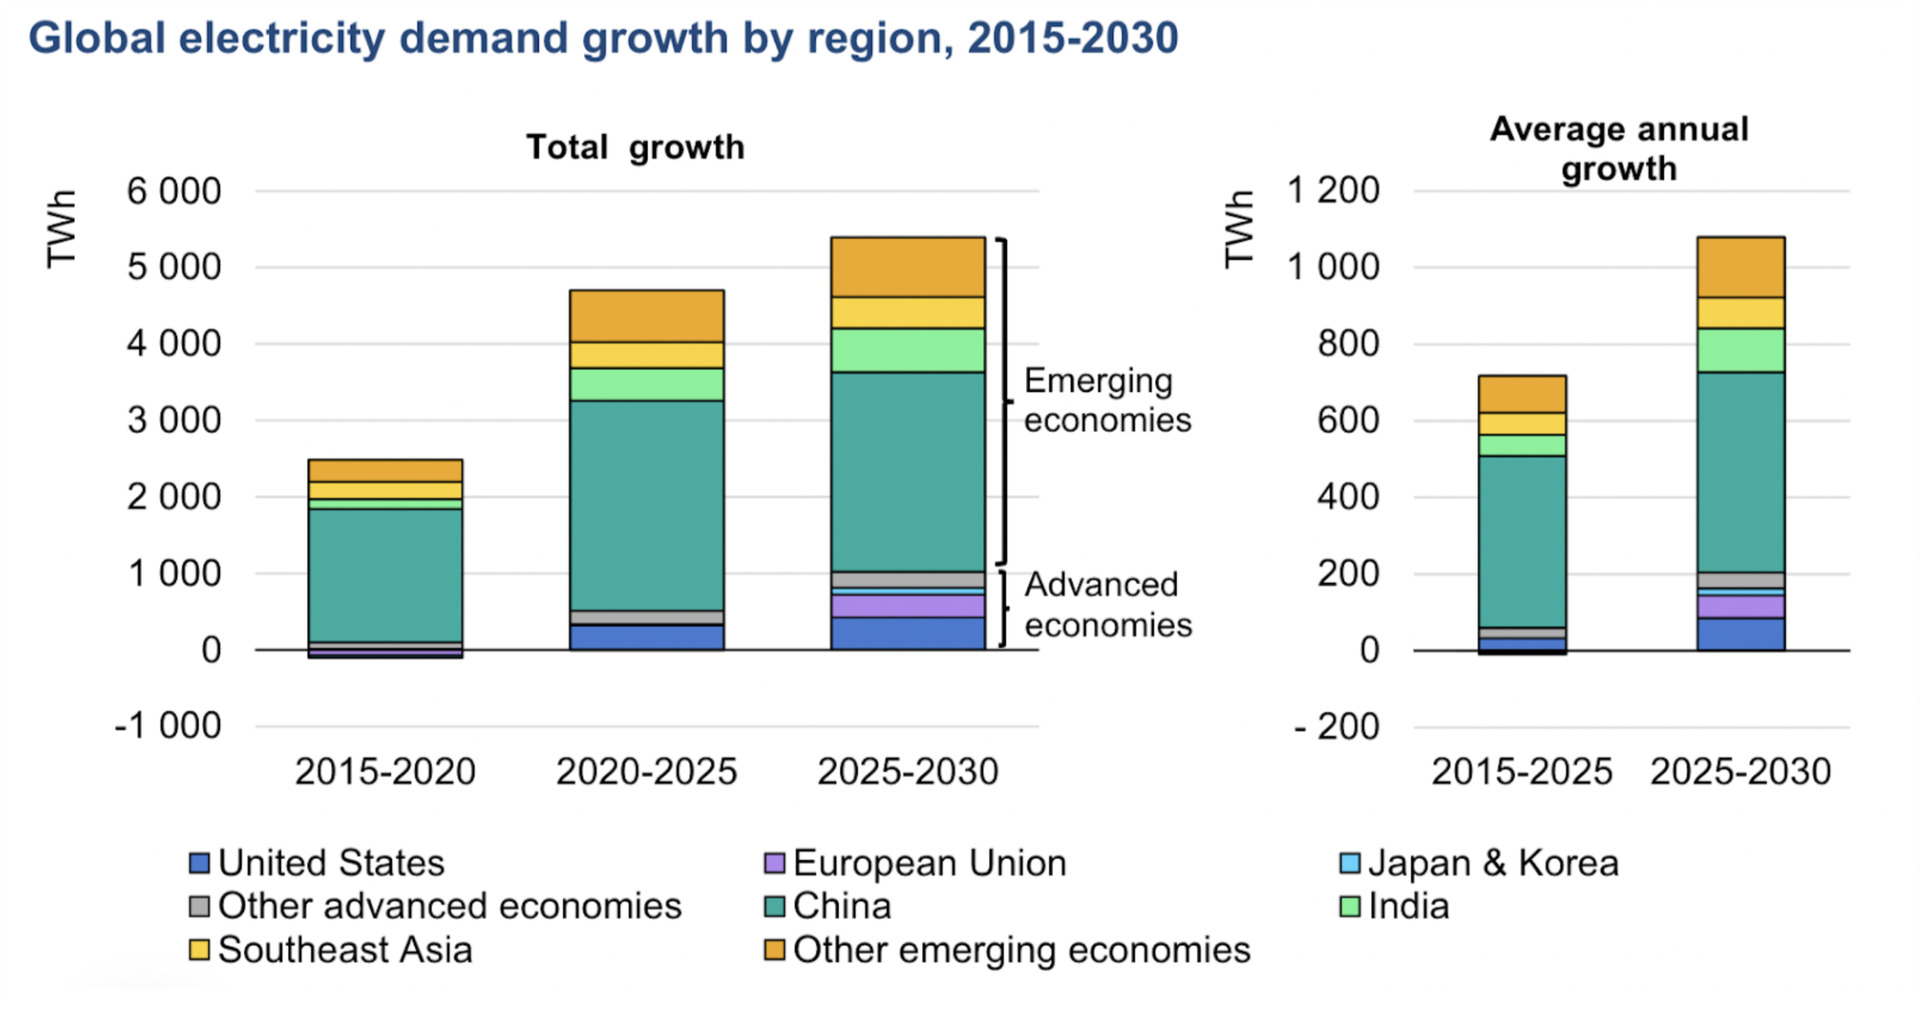
Through 2030, electricity consumption is projected to grow at least 2.5 times faster than overall energy demand. Global electricity consumption is expected to reach 33,600 TWh in 2030, up from 28,200 TWh in 2025, adding approximately 1,100 TWh annually, compared to 700 TWh in the previous decade.
Close to 50% of this increase will come from China. Emerging economies are projected to account for over 80% of additional electricity consumption. The main driver of this growth is the industrial sector, but most of the growth comes from non-heavy industries like solar PVs and battery manufacturing.
What’s more interesting is that after 15 years of stagnation, advanced economies also show growth in electricity demand. The main reason that seemingly every economy needs more electricity is the AI boom and the need for the rapid expansion of data centers. In the United States, data centers will account for 50% of demand growth out to 2030, while in previous decades they have accounted for less than a quarter.
Fossil fuels: growth or decline?
Even as the world moves forward, coal remains the single largest source of electricity globally. However, its global share is projected to drop from 34% to 27% by 2030. Globally, coal-fired output is forecast to decrease by an average of 0.9% annually over the 2026-2030 period.
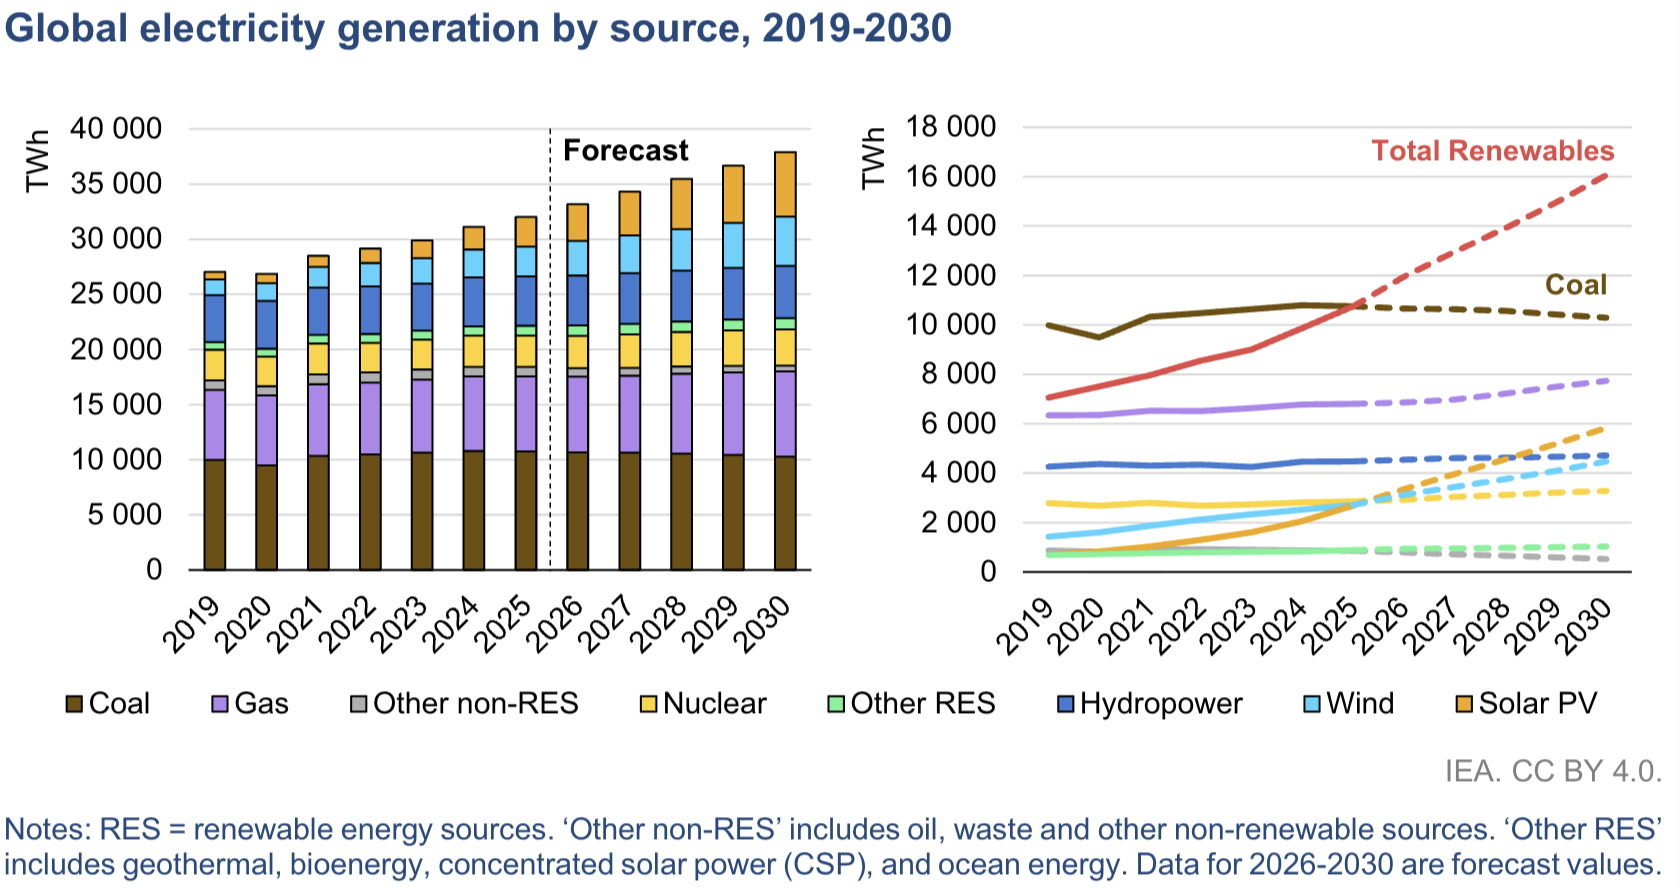
In developing countries, progress is present, but slow. In China, the production of coal-fired electricity is expected to decrease only slightly, averaging a 0,5% drop in the 2026-2030 forecast period, while its total share drops from 55% to 43%. India, on the other hand, is expecting an average annual drop of 2,3% over the forecast period, yet coal will still supply more than 60% of the country’s electricity.
In advanced economies, progress is more rapid, reflecting a determination to adopt greener electricity sources. In the U.S., declines in coal-fired generation over the forecast period are expected to average 6% from 2026-2030. EU shows a more drastic move from coal, with the industry falling by an average of 16% annually over the forecast period.
While coal-fired electricity generation is set to decline globally in the coming years, there is no uniform global pattern. Economies differ in their reliance on coal; some can reduce coal-fired generation quickly, while others are more dependent. Globally, IEA forecasts a decrease by an average of 0.9% annually in coal-fired output in the next five years.
Is electricity actually getting cleaner?
In recent years, CO₂ intensity of electricity generation has been declining, by 2,6% in 2024, and by 3,0% in 2025. The IEA projects an acceleration of this trend with CO₂ intensity declining by 3.7% annually on average over the 2026-2030 period and by close to 20% overall by 2030. The most effective climate change strategy is currently being implemented by the EU. With a projected 13% reduction of carbon intensity each year, the EU is set to halve its carbon intensity by 2030.
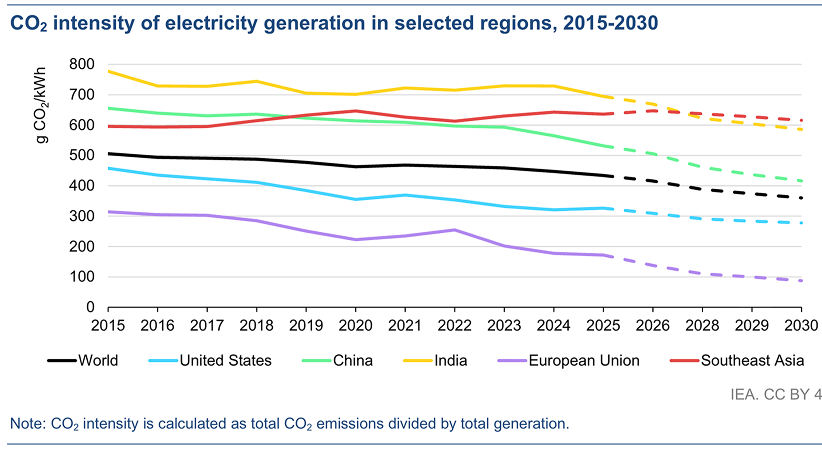
China is also making significant progress. With annual reductions of around 4.8%, its CO₂ intensity is projected to fall from 530g CO₂/kWh to 415g CO₂/kWh — more than in the EU in absolute terms. As the world’s largest electricity producer, China’s shift has major global implications.
In contrast, India and Southeast Asia present a slower trajectory. India is seeing a modest 3.4% annual decrease, moving from 695g CO₂/kWh to 585g CO₂/kWh. Southeast Asia is at a 0.7% reduction, barely changing from 640g CO₂/kWh to 615 CO₂/kWh. This tendency places the region at the top of carbon intensity charts.
Related Articles
Here is a list of articles selected by our Editorial Board that have gained significant interest from the public:
Congested grids and connection queues
As electricity demand grows, it is becoming increasingly harder to keep up with all the new connections to the grid. Globally, there are at least 1,700 GW of renewable energy projects and over 600 GW of battery storage projects in advanced stages stuck in connection queues as of 2025. This situation indicates limitations in the grid’s capacity, which slows field expansion. At least 150 GW of data center projects are in advanced stages, but are stuck for the same reason.
Investments in electricity grids are significantly behind investments in electricity generation. The mismatch can lead to unfulfilled demand in the future. By 2030, investments in grids would need to increase 50% in annual contributions. Leaving the situation unchanged can lead to curtailment.
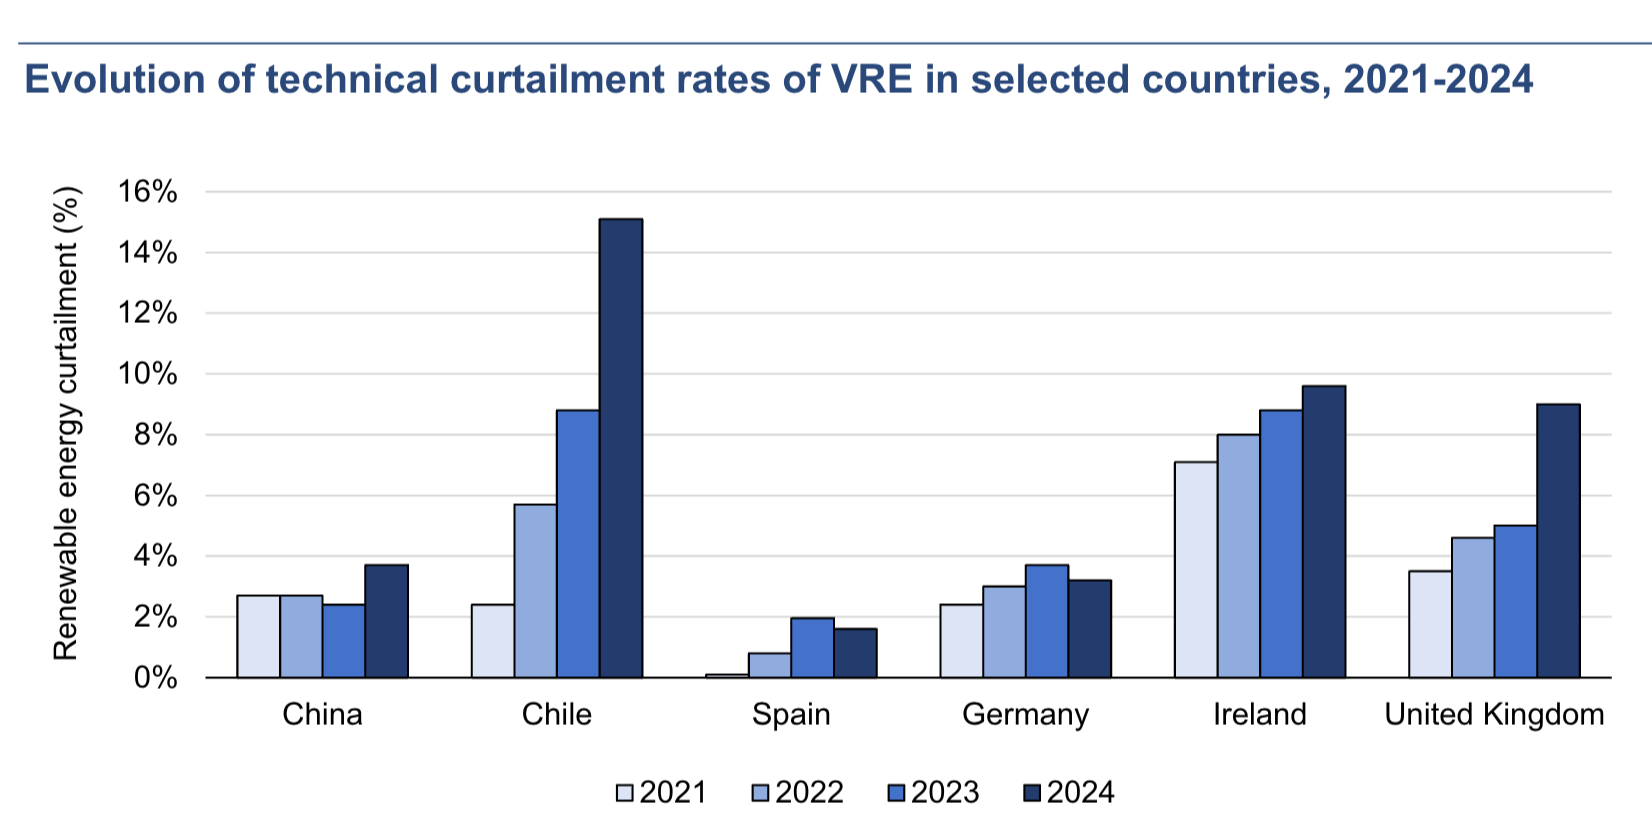
Grid bottlenecks are the main limitation of energy output. If power generation is curtailed, it’s wasted energy, and its proportion is growing in economies that are leaders in the field. In Chile, 15% of wind and solar PV generation was curtailed in 2024, the highest rate since 2017. This example is extreme but shows the general trend of increased curtailment over recent years.
Variable renewable energy (VRE) includes wind and solar PV generation; its curtailment results in significant losses for generators and discourages consumers from transitioning to these sources. If the problem results in unused low-emissions energy, it can increase CO₂ emissions from fossil-fuel-fired plants when VREs are overloaded. Regulatory reform and technological upgrades can ease these constraints, but both require significant investment and policy support.
Can renewables meet the increasing demand?
The share of renewables is growing, while fossil-fuel power generation is either declining or stagnating, suggesting that renewables can meet increasing electricity demand. In the EU, renewables are expected to meet all demand growth in the forecast period, with solar contributing more than 70% of the added electricity capacity from 2025 to 2030. The forecast share of renewables is expected to increase from 48% to 63% in the region.
China’s additional electricity demand between 2026 and 2030 is also expected to be met by low-emissions sources. In the US, Southeast Asia, and India, the overall share of renewables is expected to reach around 20-30% by 2030 with modest annual growth, showing that it would not be possible for these economies to meet the increasing demand with only renewable sources. In India, for example, rapid demand growth — averaging 6.4% annually — means solar alone would cover only about half of new demand, with coal still playing a substantial role.
The issue with projections is that they can be really sensitive to how we build up our renewable energy sources. Between 2026 and 2030, renewables, gas, and nuclear energy are expected to cover all the additional electricity the world needs. If we do not build up our renewable energy sources fast enough, we will have to rely more on other sources of energy.
By 2030, renewables will form a much larger share of global electricity. But coal will still play a major role in power generation. Whether the next decade delivers a true structural transformation will depend not only on building renewable capacity, but also on expanding and modernizing the grids that make the transition possible.
Editor’s Note: The opinions expressed here by the authors are their own, not those of impakter.com — Cover Photo Credit: Kelly.