Global data centre water consumption is currently estimated at 560 billion litres per year — roughly equivalent to flushing every toilet in Germany for a year. By 2030, that figure is projected to roughly double, to over 1 trillion litres annually.
These numbers appear in policy documents, trade press, and sustainability reports with some regularity, and they are broadly defensible. They are also incomplete if one wants to analyze or estimate a particular facility or make data-driven decisions.
People split water use in data centres into three categories.
- Direct water: the water a facility consumes through evaporation or humidification systems. It is the most accessible metric and is usually the one disclosed.
- Indirect water: kilowatt-hours drawn from a power plant that carries associated water costs in steam and cooling, none of which appear in any operator’s disclosure.
- Per-query water: meaning “a GPT response uses X litres,” a largely journalistic invention, not without significant caveats and broad assumptions.
So, the question arises: With the AI revolution and explosive expansion of data centres, which, as is well known, require vast amounts of electricity that are often not sustainable, what about the water cooling that all this new AI infrastructure needs? How sustainable is it and do we have early data?
To answer it, I have drawn on two primary sources which do provide us with a glimpse of things to come.
The first is metered billing data compiled by WRc and MOSL covering 208 of 453 registered data centres in England between 2020 and 2024 — the most detailed sector-level dataset of its kind anywhere in the world.
The second is a peer-reviewed decomposition study from Lawrence Berkeley National Laboratory (LBNL), published in Resources, Conservation and Recycling in 2025, which isolates water intensity as accurately as possible.
Why pick England? Because it represents something close to a best-case scenario: temperate climate, relatively low-carbon grid, and a functioning non-household water market that generates metered records. What the data reveals from that best case is not reassuring. What it implies for almost everywhere else is worse.
Why is it impossible to calculate water usage per query?
The most engaging figures, such as litres of water per AI query, per email sent, or similar versions, are almost impossible to calculate accurately for a specific facility, let alone the market as a whole, without enormous error margins.
Research published by Lawrence Berkeley National Laboratory in 2025 demonstrates why.
Across the full range of data centre types and configurations, water intensity varies by roughly 10,000 — from facilities consuming less than a litre per megawatt-hour of IT load to those consuming tens of thousands.
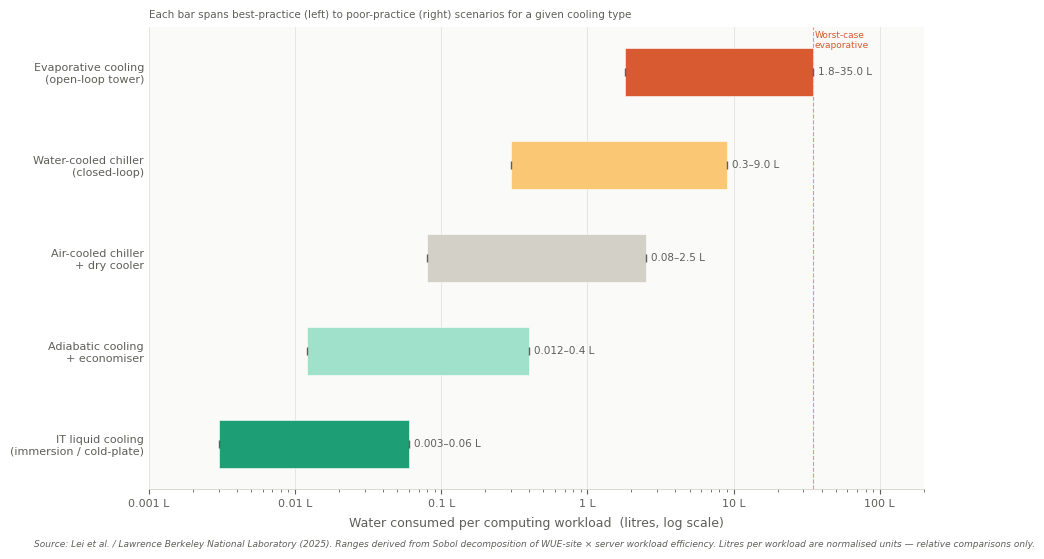
The LBNL researchers used Sobol sensitivity analysis to rank the eight primary determinants of water use. Server energy efficiency ranked first. The water consumption factor of the local electricity grid ranked second. Cooling type ranked fourth. This variable, which comes to mind first, matters less than the IT equipment onsite and the carbon and water intensity of the grid it draws from.
There is no per-query metric that sidesteps this. A query can be processed in a hyperscale facility running liquid-cooled AI chips on a near-zero-carbon Nordic grid. It can also end up running at an air-cooled facility in Phoenix, drawing from a gas-heavy grid in summer.
Averaging across these is a drastic simplification. The data centre water use cannot be aggregated across sectors. There is a 10,000 times difference between the most and least efficient solutions.
Largest facilities are responsible for the majority of data centre water usage
The MOSL metered dataset covers 208 of England’s 453 registered data centre facilities. It is the largest available sample from any single jurisdiction.
The headline finding is that looking at all data centres might not be needed as 67% of facilities use fewer than 1,000 cubic metres of water per year. Such a number is comparable to the consumption of a small office building. On the other hand, the top six facilities account for 65% of the sector’s total water consumption and they are worth looking at.
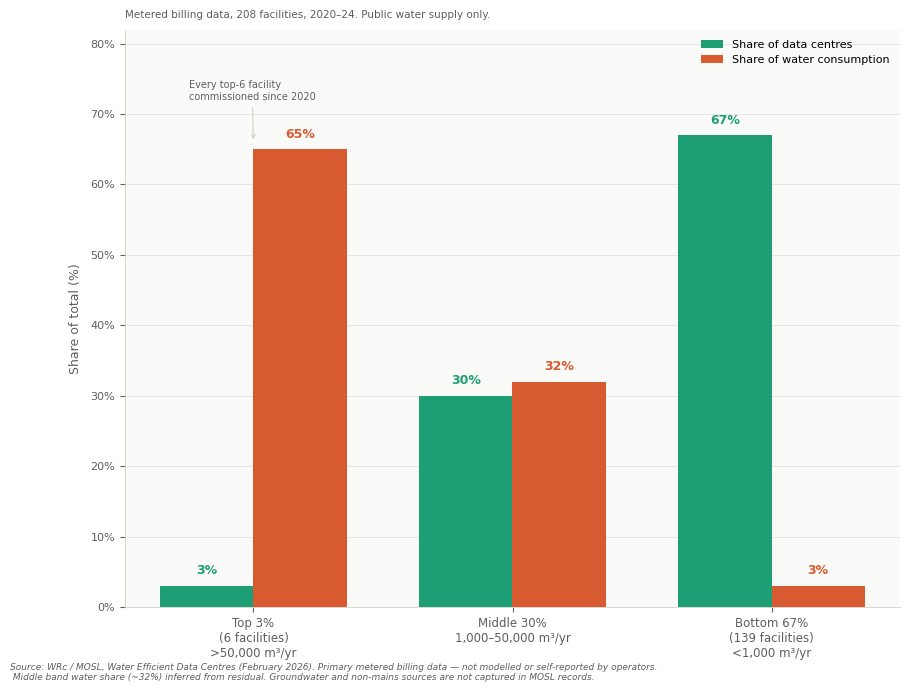
The largest consumers are large hyperscale and colocation facilities with high-density cooling systems and continuous 24/7 operation. Their consumption is not incidental; it is the structure of the field.
Total estimated sector consumption in England is approximately 1.879 million cubic metres per year. That represents around 0.2% of total non-household water use in England — not a crisis figure on its own terms. The question is whether the regulatory framework for large individual facilities is ready to meet the increasing demand of the booming AI market.
Data centre water usage is unavoidable
For the future of data centre infrastructure, water-based cooling is simply unavoidable and should be considered a primary variable.
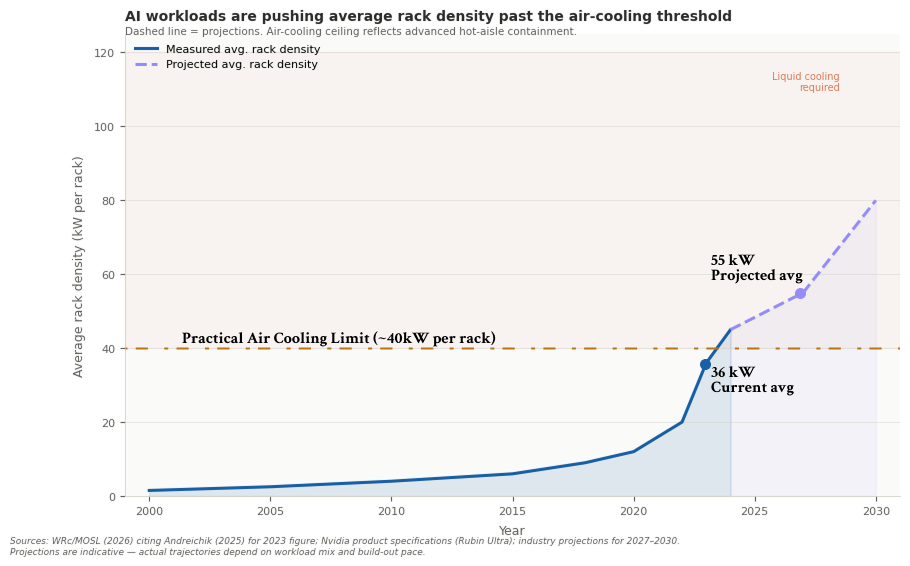
Current-generation AI server racks from Nvidia and AMD produce sustained power densities of 50 to 100 kilowatts per rack. Standard air cooling — the default for the overwhelming majority of data centres built before 2020 — becomes thermally inadequate above roughly 10 to 15 kilowatts per rack.
Liquid cooling and air cooling have fundamentally different water profiles. In low-temperature climates, air cooling can rely heavily on free cooling and consume almost no water. Liquid cooling systems, on the other hand, require active maintenance. Depending on the outside heat, it can require significantly more water.
The transition is not optional for facilities hosting current-generation AI workloads. Operators who want to keep up with evolving infrastructure are not prioritizing liquid cooling for sustainability. The main constraint is physics.
What this means for the sector’s water trajectory is that the facilities being built and retrofitted right now to accommodate the current wave of AI infrastructure are making cooling architecture decisions whose water consumption will be increasing for 15 to 20 years.
It would be convenient if retiring evaporative cooling could solve the water problem. The LBNL data establishes, with some clarity, that this trade-off is not as beneficial as it seems. Cooling systems that minimise water consumption tend to require more energy. Systems that minimise energy consumption often consume more water.
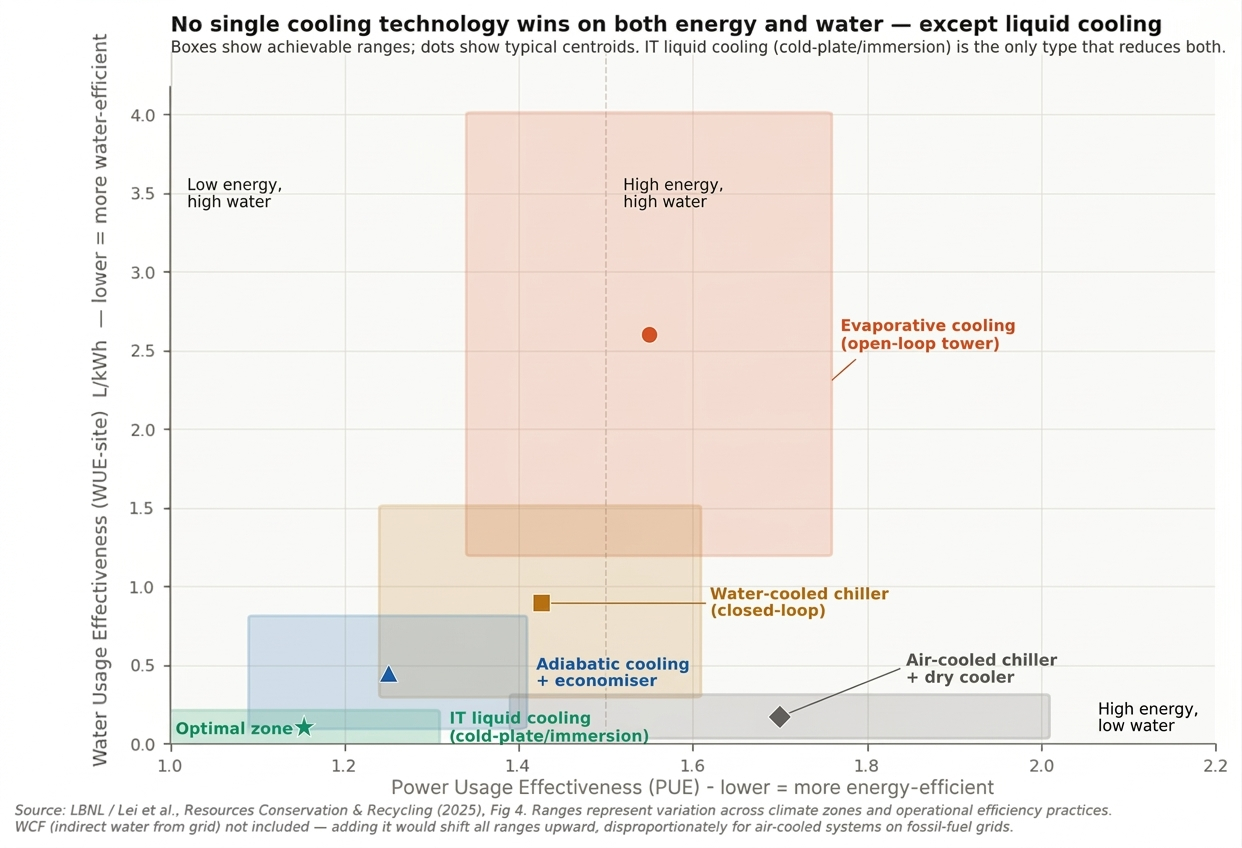
Immersion cooling leads the technical direction for newly built ultra-high computing density data centers with its exceptional energy efficiency. Free-air cooling is the approach many hyperscalers in cooler climates use. Pulling in ambient air to reject server heat can be an optimal solution, but its Power Usage Effectiveness (PUE) can become too high in hotter locations and seasons.
Adiabatic pre-cooling is the method of adding water evaporation to hot air to improve efficiency during warmer periods. It improves the energy picture at the cost of water. Direct liquid cooling improves both PUE and the ability to handle high rack densities, but shifts the water question to the heat rejection system.
Finding an escape from the trade-off is extremely difficult, but some of the newest technologies are striving to balance energy, water, and carbon emissions.
Related Articles
Here is a list of articles selected by our Editorial Board that have gained significant interest from the public:
Global warming puts an additional layer of strain on cooling systems
Evaporative cooling systems are most water-intensive when outdoor temperatures are highest. Higher ambient temperatures force systems to run at higher evaporation rates to maintain equipment within limits.
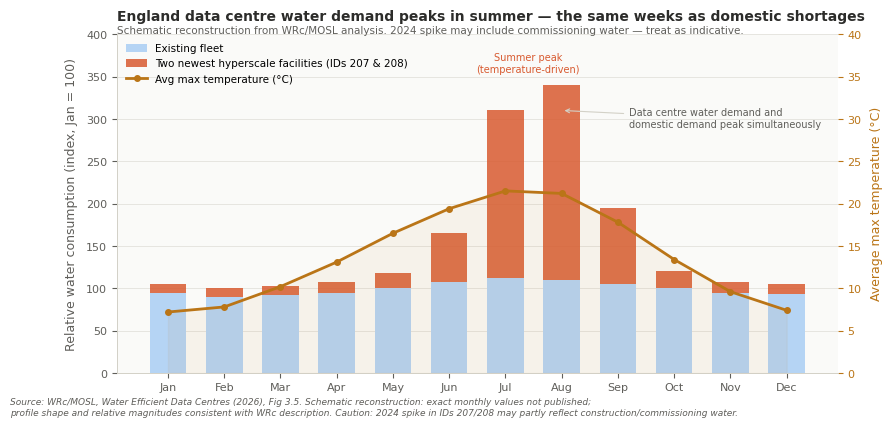
This overlap is not a crisis at the moment. It is a structural vulnerability that is expected to worsen with global warming. UK Climate Projections anticipate longer and more intense summer dry periods across southern England by mid-century.
The facilities most exposed are those relying on evaporative cooling to handle peak loads, which describes the majority of large sites.
The climate risk here runs in both directions.
Hotter summers increase cooling demand, increasing water consumption, precisely when water stress is highest.
And hotter summers reduce the number of hours during which free cooling can substitute for mechanical systems, eroding the efficiency gains that have held water use relatively stable during the past decade.
England is the floor for data centre water consumption, not a benchmark
England provides the most detailed data on data centre water consumption at the sector scale. It also represents close to ideal conditions: a cool, damp climate that maximises free-cooling hours. It also sits on a grid that decarbonises faster than most European peers.
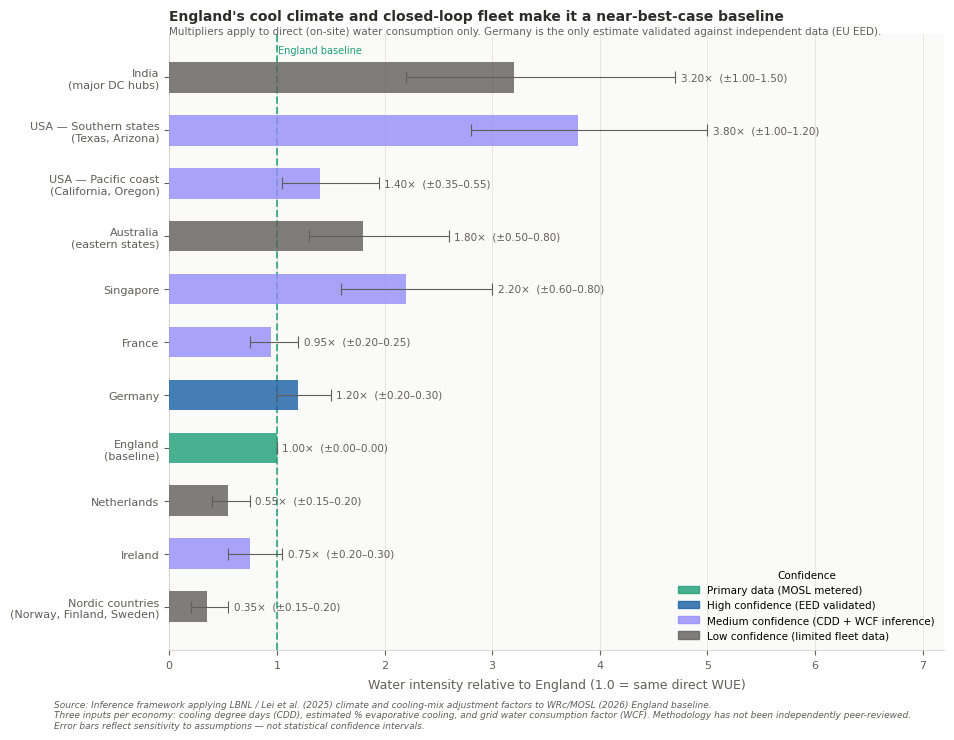
This graph roughly estimates a cross-economy inference, using England as the index at 1.0. Germany is the only comparable country, validated by the EU Energy Efficiency Directive: a signal that the country is adapting to the latest goals and regulations on the matter. Its water usage sits in a comparable range: similar climate, similar grid carbon intensity, similar regulatory environment. The multiplier is close to 1.0.
The picture diverges sharply from there.
As noted in the above diagram, US data only rates “medium confidence.” Moreover, centre clusters are concentrated in the mid-Atlantic corridor and the arid Southwest — Phoenix, Las Vegas, Northern Virginia — face therefore higher ambient temperatures, more cooling-degree days, and, in many locations, significantly higher grid water consumption factors from thermal power generation. The situation in the US is around 2-5 times worse compared to England.
These are not measurements. They are the product of applying the available framework’s determinants — climate zone, grid water consumption factor, and cooling type distribution — to regional characteristics, and cross-checking them against the limited disclosure data available.
Germany is the only country where the estimate is accurate and based on the available data on water usage in data centers. The other estimates are intended as signaling a trend and not meant as precise figures. Even though England’s baseline comes from just six facilities, it likely still underestimates what we would see in most other major data centre markets.
How will the industry fill the half-empty glass?
The data centre sector is in a transition. Facilities built through roughly 2020 were designed around air cooling at moderate rack densities. The AI infrastructure now under construction requires liquid cooling; air cooling cannot physically serve new rack densities.
This transition creates a gap. Water demand skyrockets. New cooling systems require operational tuning. Facilities that have never been required to report water consumption are being replaced by facilities that, in most jurisdictions, remain for now equally unobserved. But the problem is that each one of them will consume water like a thousand offices.
The risk window is now. Not because the sector is in crisis, but because, over the next three to five years, infrastructure decisions will define the sector’s water profile for the following two decades.
Permitting, site selection, cooling architecture, and grid connection — all of these are being decided before mandatory water reporting even exists in most jurisdictions. Where will the water come from? What are the regulations to determine that? Are there any? The answers are either unclear or contradictory.
England’s data shows a handful of facilities dominating consumption, a seasonal pattern, and, most importantly, a structure that enables regulatory intervention. It resolves a question that aggregate estimates cannot: where water use is concentrated, when it occurs, and which facilities drive it.
The answers are consistent across the dataset. Consumption concentrates among a small number of large sites. It rises during periods of peak system stress. And it is shaped by variables — climate, grid characteristics, and cooling architecture — that differ materially across regions.
In most markets, including the US and continental Europe (with the exception of Germany), these relationships remain unobserved. Without facility-level reporting, there is no way to identify high-impact sites, assess seasonal risk, or evaluate trade-offs between energy and water use. Policy frameworks built on sector averages cannot capture dynamics that are, by construction, local and highly uneven.
England demonstrates that these dynamics are measurable. The absence of equivalent data elsewhere is therefore not a limitation of methodology, but of governance.
Editor’s Note: The opinions expressed here by the authors are their own, not those of impakter.com — In the Cover Photo: Cooling fans. Cover Photo Credit: Andrey Matveev