Artificial Intelligence (AI) consumes a lot of energy. But how much exactly? What makes the answer both intriguing and complex is that the carbon footprint of a data center depends heavily on where it is located.
Studies estimate that data centers around the world could have produced up to 80 million tons of CO₂ in 2025. This is comparable to a small European country. The use of water for cooling data centres is comparable to the entire bottled water market. Europe hosts about 15% of global data centres, which generally run on cleaner grids, while the United States hosts close to half on dirtier grids. The difference in carbon intensity is almost double: 174 gCO₂/kWh in Europe against 321 gCO₂/kWh in the U.S.
The same query, processed on the same model, can have a carbon footprint that varies by a factor of eight or more, depending on where the server is located. The exact numbers are unclear, but the differences in carbon intensity, AI electricity usage, and the renewables share are enough to paint a clear picture.
Grid intensity on the map
Grid carbon intensity — measured in grams of CO₂ per kilowatt-hour — is the key variable that translates electricity consumption into a carbon cost. Data on electricity generation, capacity, emissions, and demand from over 200 geographies allows for a detailed analysis of the global grid and its emissions. This metric reflects both the amount and the type of energy used.
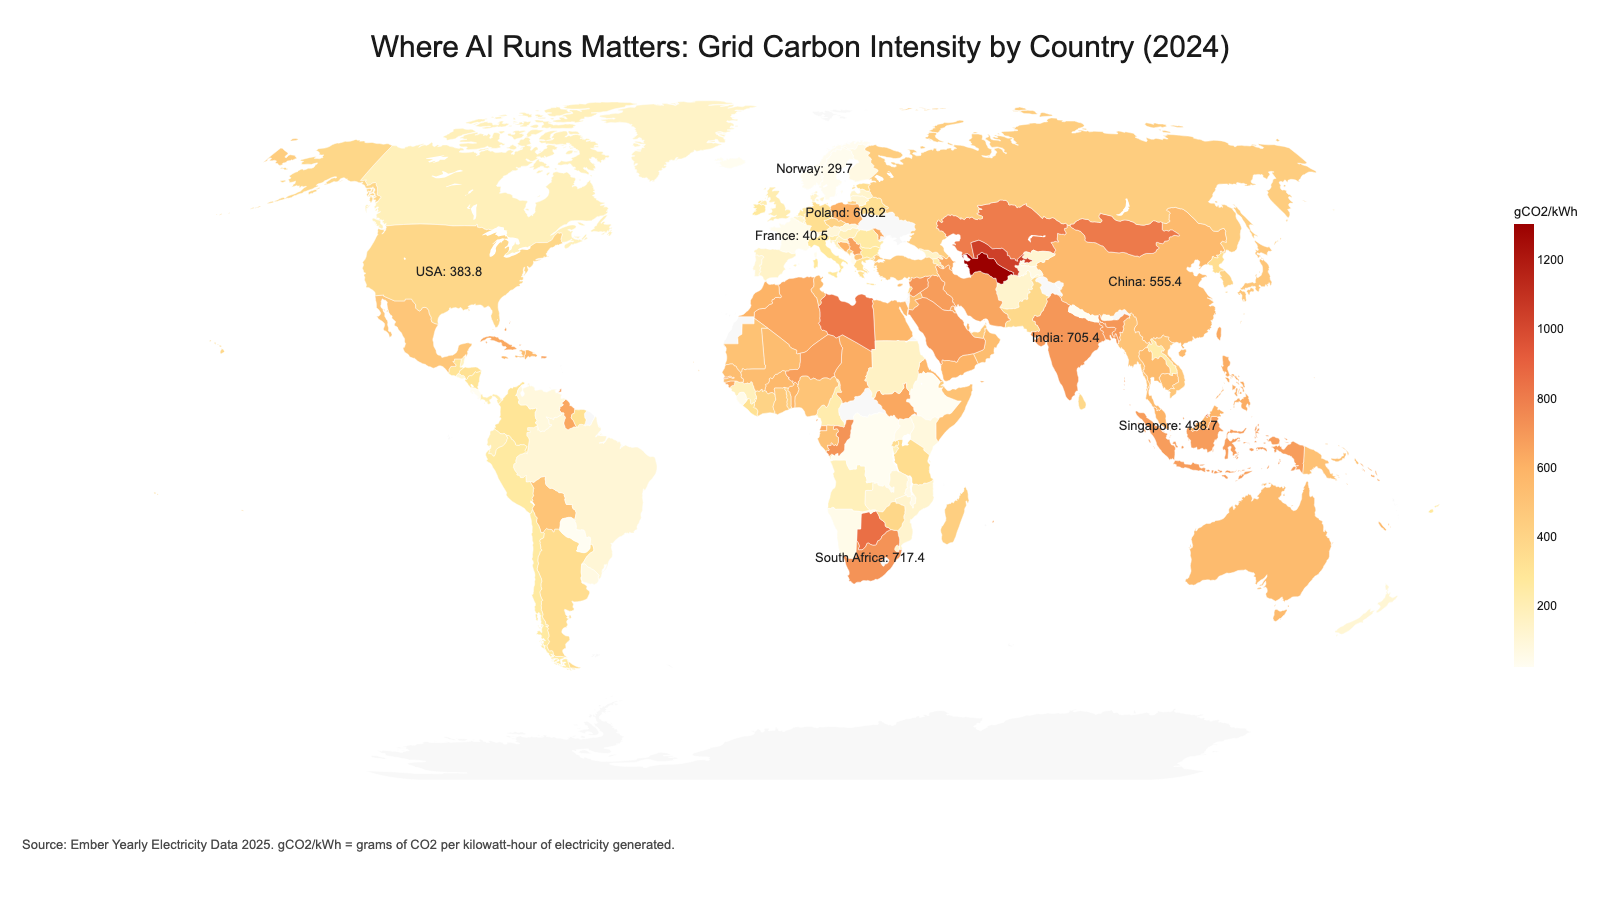
There is a clear regional picture. Western Europe and the Nordics use the cleanest energy; Eastern Europe, Asia, and Africa have the highest grid intensity. Carbon intensity in the Americas differs, but in general, the grid intensity is not the highest in the region. The map’s first conclusion is regional — clean grids cluster around specific policy histories and resource endowments, not wealth alone.
Renewable and low-emission energy sources mostly power the cleanest grids. Norway relies almost entirely on hydropower and has the lowest grid intensity at 29.7 gCO₂/kWh. France is nuclear-dominant and gas the grid intensity of 40.5 gCO₂/kWh. This example proves that achieving low intensity is not as simple as a single answer for any country. Geographical proximity to water enables Norway to rely on hydropower, while the French nuclear plant’s location is highly strategic.
At the other end of the spectrum lie countries with the highest electricity intensity. A significant data center infrastructure in these countries results in emissions up to 25 times higher than those of the cleanest grids. Countries like South Africa, Poland, and India are coal-heavy, leading to higher emissions from energy generation and AI infrastructure.
Carbon intensity in the largest economies, which host most data centers, such as the US, Germany, and China, is moderate. It is important to note that, in the States, the number seems to be declining, as it’s by far the leader in data centers. In 2024, the carbon intensity was 353,8 gCO₂/kWh, and it’s now down to 321 gCO₂/kWh, according to the latest 2025 data, despite the current administration’s anti-ESG stance. A similar situation is unfolding in Germany, where carbon intensity has been declining since its peak in 2021. In four years, Germany has achieved a 27% decrease, from 419,74 gCO₂/kWh to 329,65 gCO₂/kWh.
This analysis uses average grid carbon intensity — the mean emissions per kWh across a country’s entire generation mix. It would be more insightful to use marginal carbon intensity, which is unfortunately unavailable for most countries. It would show if a national grid can keep the intensity number from rising with added infrastructure. This factor is the main reason Norway or France can’t host new data centres.
How does each query add up to the AI carbon footprint?
Unlike emissions intensity, there is no clear method for measuring emissions. Different estimates can vary by a factor of sixty. The most methodologically rigorous recent estimate comes from a 2025 Microsoft Research paper, which derived a median of 0.34 Wh per query for frontier-scale models under production conditions — explicitly correcting for the tendency of benchmark-based studies to overstate energy use by four to twenty times. It provides a solid baseline for comparing carbon emissions from AI infrastructure across different grids.
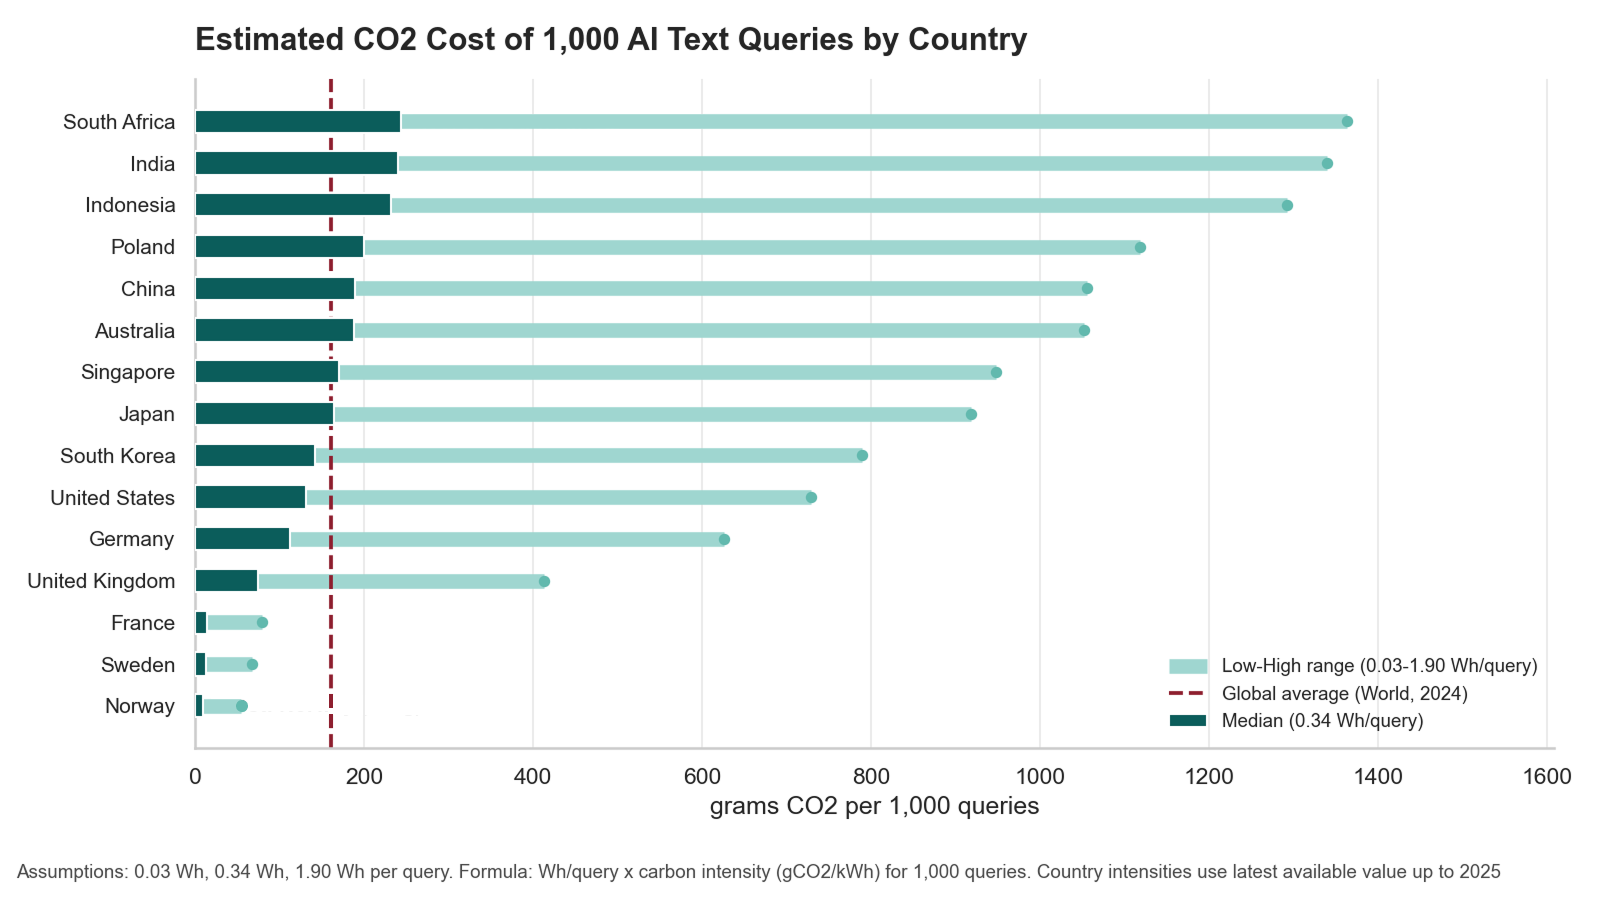
This analysis uses three energy-per-query scenarios — 0.03 Wh, 0.34 Wh, and 1.90 Wh — representing the low, median, and high ends of current peer-reviewed estimates. The median figure is treated as the central case because it is derived from production rather than benchmark conditions. There is an assumption that energy consumption per query is uniform across geographies, but in reality, data centres in hotter climates consume more energy for cooling.
Another important detail is that older hardware runs less efficiently than newer installations. Both factors would increase the carbon cost in regions that already appear worst in this analysis. The gaps shown here are likely conservative rather than overstated.
Using median estimates and carbon intensity figures, 1,000 queries in Norway would produce 9,6 gCO₂, while the same number in South Africa would produce 243,9 gCO₂. This huge gap indicates that 1,000 queries executed in a data centre in South Africa are equivalent to 25,400 executed in Norway. It is solely a grid-connected issue too, not model differences.
For comparison, based on carbon intensity, the estimate of energy per query becomes less important in the grand scheme. Any AI model would emit less in France than in Germany or the US. In the US, the estimated emissions are slightly lower than the mean, yet the figure remains critical. The United States accounts for around half of the global data center capacity, so a step towards a cleaner grid might be more important than one towards new data centres. The same is true of the other major players, such as Germany and China. These economies might benefit economically from developing the latest technology, but the rising costs of AI infrastructure might shift the focus even further towards decarbonisation.
The more important problem is that the global supply of data centres is located on grids with higher carbon intensity. It’s also extremely difficult to build data centres on cleaner grids from scratch, due to the required upfront investments and the current extreme undersupply of memory chips. Choosing a cleaner grid matters more than choosing a smaller model — and that can only happen by decarbonizing the grids that currently host most AI infrastructure.
Related Articles
Here is a list of articles selected by our Editorial Board that have gained significant interest from the public:
Is the AI infrastructure located on higher-intensity grids?
The previous section showed geography determining the carbon cost of data centers. The natural follow-up question is whether data center investment reflects that reality. Answering it requires combining grid intensity figures with the geographic distribution of data center infrastructure. Such mapping would also show the general global trend: do high-intensity grids host more AI infrastructure than low-intensity grids?
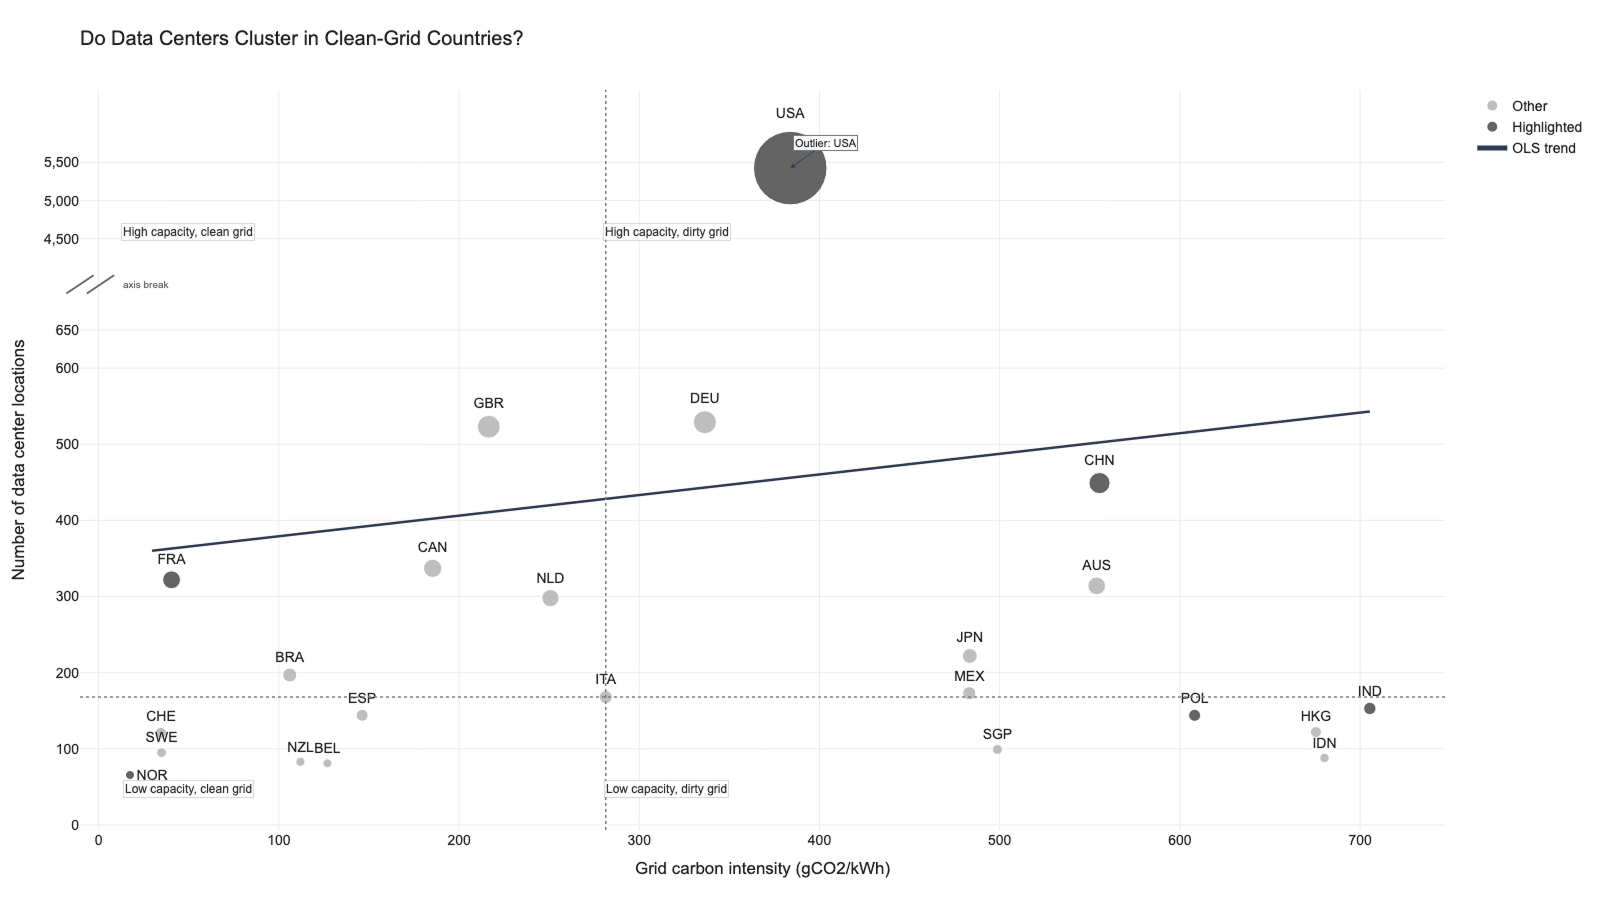
The overall pattern suggests that data center investment has been driven more by economic and connectivity factors than by carbon considerations. This finding is unsurprising historically. While we advocate for sustainable development, the global trend points to economic gains and innovation over emissions reduction and a more sustainable tech sector.
The U.S. has by far the largest concentration of data centers in the world. Its grid emits roughly 400 gCO₂/kWh — not the worst globally, but multiple times worse than France or Norway. The state of Virginia is under the most intense pressure from both growing demand and its reliance on gas.
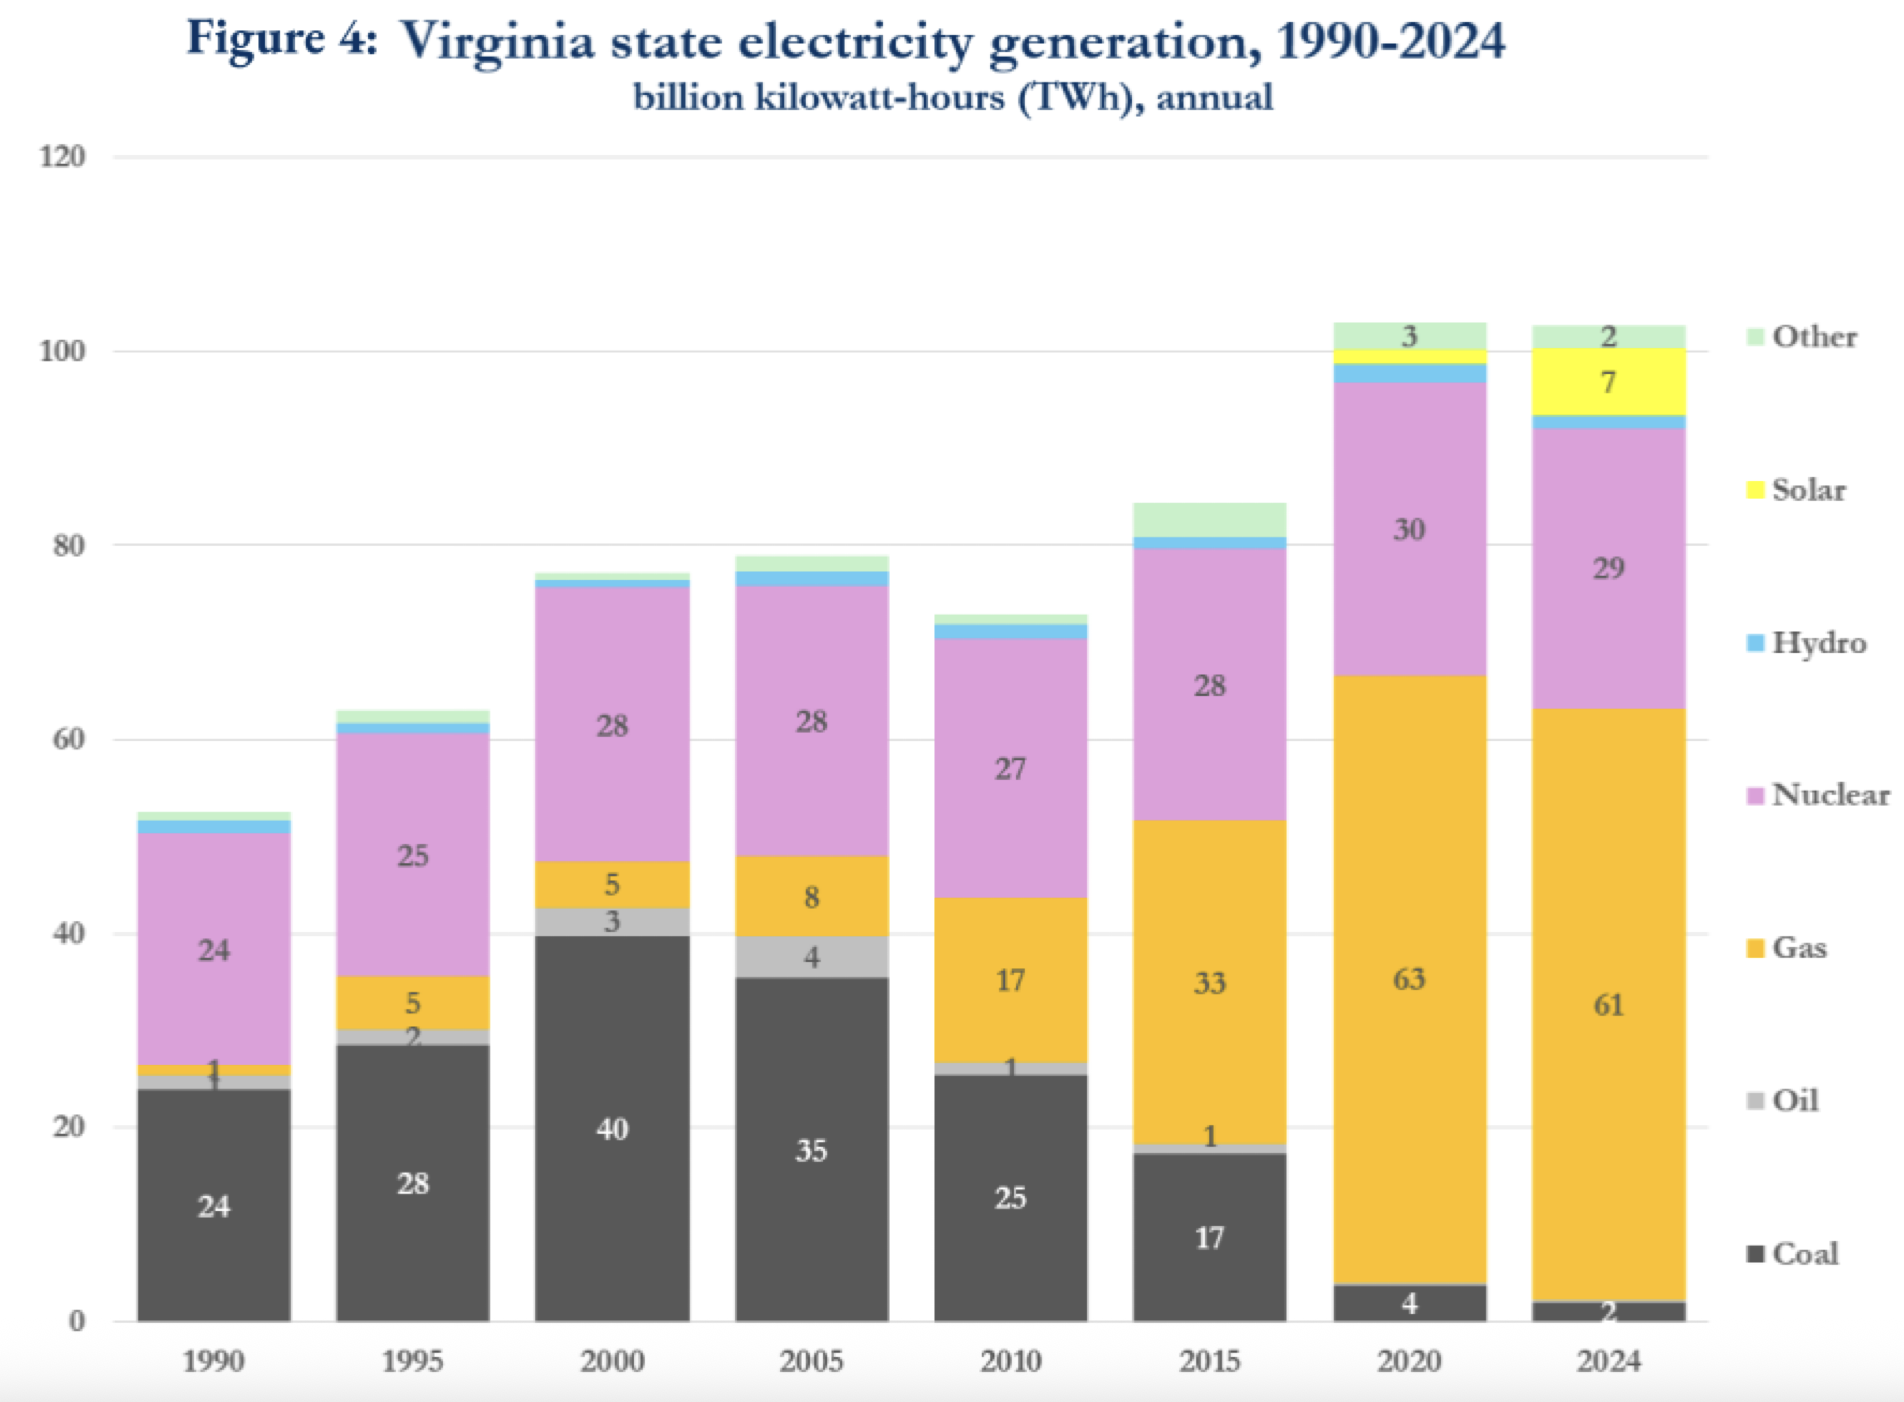
Between 2019 and 2024, Virginia’s electricity consumption grew at an annual rate of 3.1%. This is more than three times the national average growth rate of 0.9% over the same period. At the same time, from the 1990s to the present, the state has almost entirely replaced coal generation with gas, not with renewables. Gas emits 50-60% fewer CO₂ than coal, but it is still a fossil fuel. Virginia gets a significant share of its energy from nuclear power, but developing and expanding it is much more complicated than gas.
Data centre infrastructure in the US is complex and vast, but at a smaller scale, it is possible to sustain a significant amount of data centres on a clean grid. There are multiple examples of economies, like France and the UK, sustaining a significant data centre infrastructure on a clean grid. This conclusion supports the argument that a step towards a cleaner grid might be more important than one towards new data centres.
Coal-dependent economies operate the most carbon-intensive data centres. Such is the case for China, India, and Poland. These countries are defined by a large and growing data center market, but an improving grid. The dynamic nature of grids, for example, China’s grid, which is declining 4,8% annually, is the nuance that prevents a static reading of the chart from being the final word. If grids worldwide become cleaner, the chart could look about the same in five years as the situation improves.
AI carbon footprint over time
Grid carbon intensity is not static — it has been declining globally for a decade. The rate of that decline determines whether the geography gap is a structural problem or a transitional one.
The overall trend shows a clear decline in emissions from data centers, after some years of stagnation. The AI boom complicated progress on emissions reduction around 2021, but the global trend reverted to decline the following year. The global carbon-load index (calculated as grid intensity multiplied by data center locations) is down about 20% from its peak in 2008.
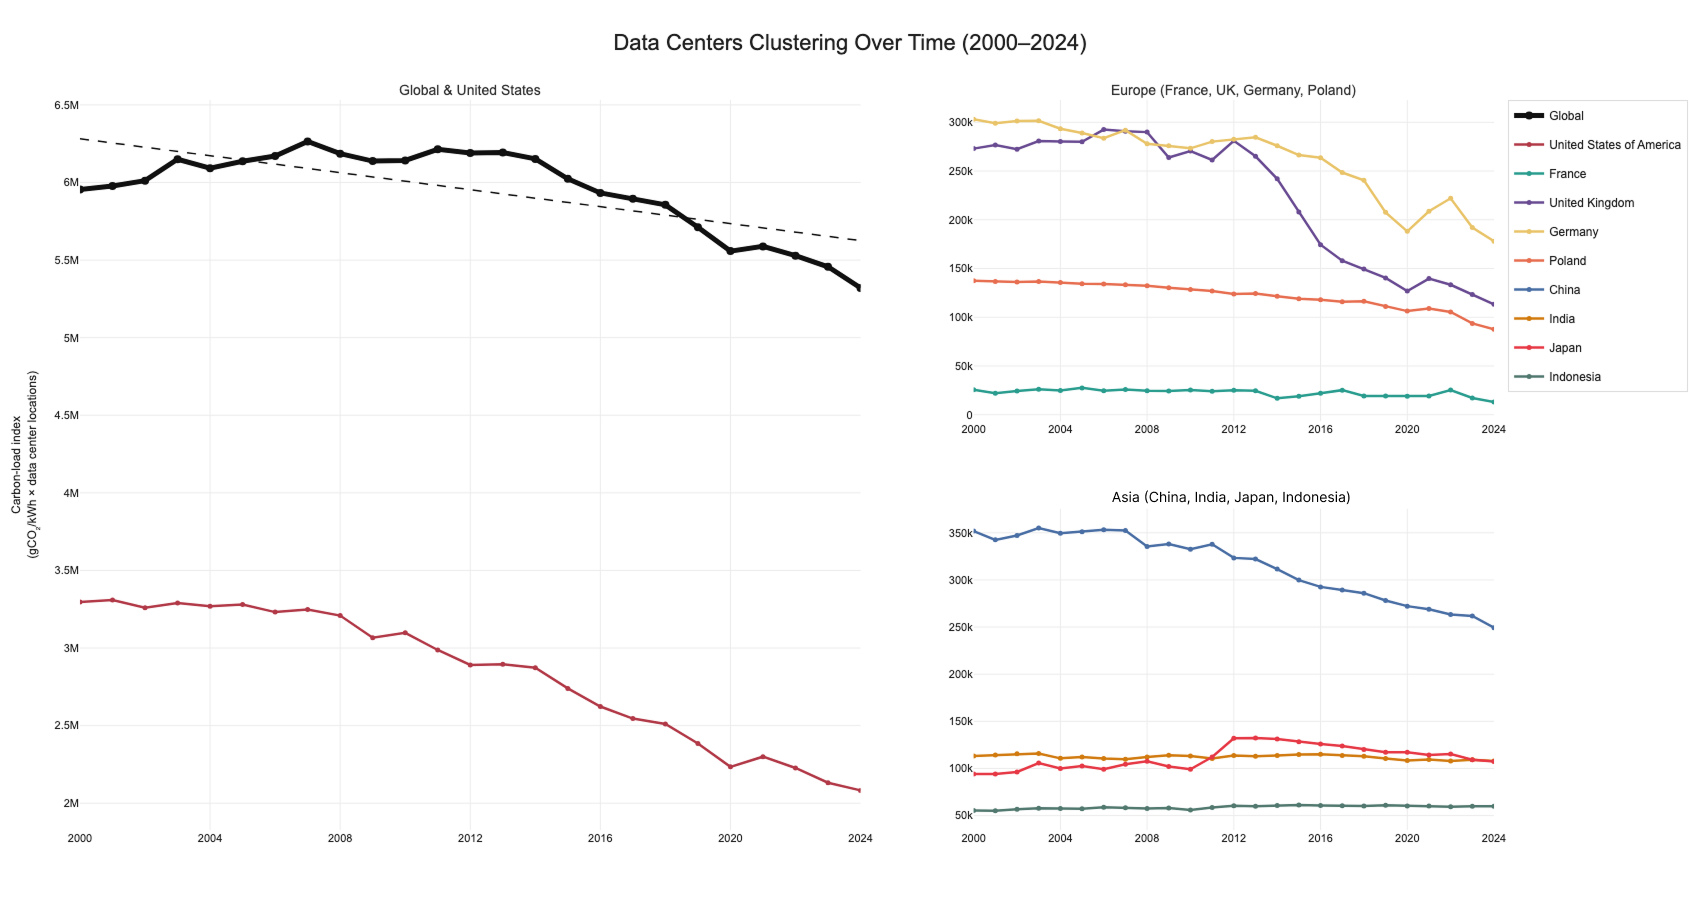
National trends tell a more interesting story. Economies are experiencing substantial declines, including the US, the UK, and China. In all of these countries, the decline is characterized by a commitment to renewables. The data center electricity demand itself has not decreased in recent years. Carbon intensity in the UK has reached low value. This progress previously might be the main reason for the conservative decline over the last few years. The US and China are on a stable, consistent path towards reducing emissions from their data centres.
For countries showing stagnation, there are two possible explanations. If it is a country with low intensity, like France, there is not much to improve upon. In such cases, stagnation reflects stability and consistent reliance on low-emission energy sources. On the other hand, for countries with high carbon intensity, stagnation is concerning. It shows that an economy is dependent on high-emission energy sources and can not transition. These include Poland, Indonesia, and India.
Economies that depend on high-emission energy sources are usually unable to transition due to rising demand. The use of renewables might grow, but in general, they will only cover additional demand in these economies. With such an approach, progress is difficult. A clear example of this dilemma is India. The country’s electricity demand growth is around 6,4% annually. The trend over time shows that new renewables might cover this additional demand, but not by much, leading to stagnation for years.
Decarbonisation rates are not linear and have historically been sensitive to policy changes, fuel price shocks, and technology deployment rates. What is clear is that the global trend is positive, and the AI boom has not reversed it.
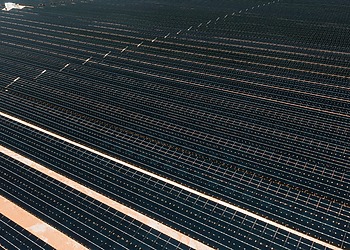
Editor’s Note: The opinions expressed here by the authors are their own, not those of impakter.com — Cover Photo Credit: NASA