In science, both zoomed-in and zoomed-out angles of observation are essential to gain accurate understanding and perspective – studying the minutiae of molecular interactions as well as the dynamics of the global population are equally as important. The same can be said for climate change. Mapping the territory of greenhouse gas (GHG) emissions at both the ground and atmospheric level is crucial to calibrate an accurate climate perspective, bring clarity to help make informed decisions, and better define action on a planetary scale.
This is the big-picture approach taken by Climate TRACE, an international non-profit backed by former US Vice President Al Gore which uses artificial intelligence (AI), satellites and sensors to track human-induced GHG emissions from low-earth orbit.
Using a fleet of 300 satellites and 11,000 remote-sensors to track emissions from every major source on the planet – Climate TRACE is capturing a detailed global emissions snapshot in real-time.
"This release makes the Climate TRACE data browser the largest open data set of global emissions inventory in history, providing valuable insights to… improve our ability to take action on climate change, globally." More from member org @EarthriseAlly:https://t.co/kLwsHHUG9e
— Climate TRACE (@ClimateTRACE) November 11, 2022
Climate TRACE technology
The project began in 2020, and – after receiving funding from Google – in 2021 released an inaugural dataset of country and sector-level emissions across the world.
But like many in the technology industry, Climate TRACE is committed to evolution, so at COP27 this week, Al Gore presented the latest developments to the organization’s data, now at the individual facility-level and divided by GHG type.
“Climate TRACE brings increased understanding and precision to emissions tracking,” says the NGO.
“Our inventory offers the most detailed and comprehensive sub-sector breakdown available to date,” Climate TRACE states.
Transparency is key to our progress on #climateaction, including transparent GHG #emissionsdata. Tomorrow, we'll take another step forward in shining a light on global sources of emissions. #Together4Transparency https://t.co/MRTSqVoiNA
— Climate TRACE (@ClimateTRACE) November 8, 2022
Over 70,000 locations – down to the level of individual power plants, oil rigs, coal mines, factories, airports, city-level transportation, and even ships in the ocean – have their surface-level emissions monitored from above, forming an inventory of each sector and subsector’s top 500 polluters.
The 60 terabytes of data captured – complemented by public and commercial industry datasets – is continuously analyzed by AI systems “trained to spot subtle differences in satellite imagery, data patterns, and more.”
Climate TRACE currently provides emissions estimates annually, however as their technology develops, they hope to bring updates at the monthly, weekly and ultimately daily level.
That’s the beauty of their technological infrastructure: It can constantly evolve, expand ground coverage, and steadily increase the level of detail captured (much like any software patch) in a way that traditional methods would be incapable of.
They hope the accurate and timely emissions data collected from their independent birdseye view can help fill the “critical knowledge gaps” in emissions coverage that “the human eye” and “traditional monitoring methods” could miss.
Transparency for policy-makers, accountability for polluters
We know how much CO2 is in the atmosphere, and we know why it’s there, but the problem is that our current method of assessing where it comes from is unreliable and unrepresentative of reality.
Up until now, the world has largely been reliant on the UN and governing bodies to consolidate self-made reports from public and private organizations disproportionately around the world, many of which are often out of date or contain holes, mistakes, and even possibly deliberate emission omissions in some cases.
“Nearly 100 countries lack access to comprehensive emissions data from the past five years, due in part to the significant challenges and costs associated with gathering accurate and timely information,” says Climate TRACE.
Related Articles: COP27 Watch: America on Track to Meet Paris Agreement Goals, Biden Says | Cutting Emissions: Can The Rich Pay the Poor To Do it On Their Behalf? | COP27: Concrete Action From Cities and Regions | G20 Spent $693 Billion on Fossil Fuels in 2021
Climate TRACE’s technology has no less than jet-propelled emission tracking efforts, combining a multitude of different data sources to fill in the gaps between surface-level emissions and atmospheric build-up, and build trust in reports through open-access third-party validation.
By bringing clarity to climate conversations, Climate TRACE’s emissions data provides transparency to policy-makers, accountability to polluters, and can help catalyze meaningful climate action.
The universal picture their technology provides enables us to better navigate the global emissions landscape, and pinpoint precise polluting hotspots to urgently focus emission reduction efforts on. This degree of coverage can help enable the international community to craft tailored climate solutions at a sector, country and even facility level.
Our partners at @ghgsat teamed up with Bloomberg for this series on #methane emissions detected via satellite. We’re grateful to have GHGSAT as a collaborator helping to make the Climate TRACE emissions inventory possible. https://t.co/EF7D6K8xoR
— Climate TRACE (@ClimateTRACE) November 10, 2022
The “Big Brother” of pollution
From their unique impartial vantage point, Climate TRACE are able to understand who is driving climate change and where at a greater level of scrutiny, identifying “anomalies and inconsistencies” in current reports.
“We’ve uncovered some significant insights about global emissions trends,” says Climate TRACE.
Emissions from oil and gas production and refining may collectively be more than double reported levels, despite being one of the most reported on industries.
“It is likely that over 1 billion additional tons CO2e per year — more than the annual emissions of the 100 lowest-ranking emitting countries combined — have gone uncounted by countries that aren’t required to report their oil and gas emissions regularly,” says the non-profit.
Up until 2020, emissions from the steel industry were on the rise:
“Steel production globally resulted in 13.1 billion tons of CO2e between 2015 and 2020, equivalent to the total emissions of Japan and the United Kingdom combined over that same period,” notes Climate TRACE.
Since then, steel emissions have declined in every country – except China, where the steel industry is “on track for an estimated emissions increase of 158 Mt CO2e, roughly equal to the entire annual emissions of Singapore.”
Nice work to Climate TRACE member @earthrisemedia, which helped make this this eye-opening @nytimes story on toxic #mining in Brazil possible. Earthrise analyzed #satelliteimagery and contributed data on the locations of illegal airstrips in Brazil. https://t.co/KBG8vALFET
— Climate TRACE (@ClimateTRACE) August 11, 2022
They also found that if the shipping and aviation sectors combined were a country, they’d be the world’s 5th largest emitter.
Climate TRACE reveals that “shipping emissions increased about 10% per year from 2018-2020 despite the COVID-19 pandemic, considerably faster than expected.”
What’s more, emissions from forest fires, road transport, and rice farms are much higher than previously thought.
“As governments set new net-zero goals, Climate TRACE data enable them to craft ambitious policies and track progress in reducing emissions,” says the organisation.
But their observations also provide a unique opportunity to “hold governments and the private sector accountable to their emissions reduction pledges.”
Climate TRACE is watching you.
— —
Correction: This article has been updated since publication to correct an error in relation to the information on steel emissions.
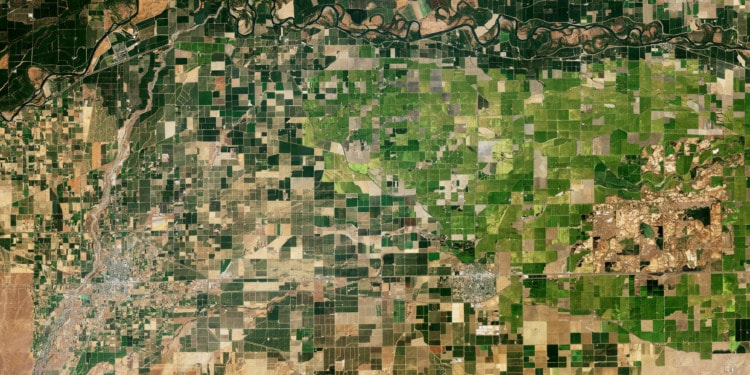
Editor’s Note: The opinions expressed here by Impakter.com columnists are their own, not those of Impakter.com — In the Featured Photo: Rice fields in California. Photo Credit: NASA Earth Observatory


